April 2022: bitcoin to drop to $20,000?

22 April 2022
Is bitcoin likely to drop to $20,000 in the next few months?
In this analysis, we will once again use a dual approach combining macro-economy and technical analysis.
1) The macro-economic approach gives us the rationale and direction of the move and the confidence to wait for it.
2) The technical analysis gives us probabilistic information on the magnitude of the move
This piece is the third of this April 2022 update series. While not absolutely necessary, it is strongly recommended to read first the post explaining the macro-economic backdrop, as well as the article articulating why gold should do well in an environment expected to display low/no growth with persistent inflation. Similarly, for an introduction to bitcoin, what it is and how it works, please refer to this post.
Summarizing the main points so far:
- My central scenario for Western economies and for the years ahead is a low/no growth context with persistent high average inflation ('stagflation').
- In this environment, scarce assets should do well. Gold (currently priced at $1,950), could deliver as low as +18% gains (i.e. gold @$2300) or as high as +350% (gold >$9000) should FOMO and an exponential growth 'a la 1970s' were to happen. A reasonable target may be about +50% (i.e. price hitting around $2700 to $3000).
- Another scarce asset is bitcoin which is programmatically limited to 21 million and hence is therefore often presented as 'digital gold'.
This post will attempt to reconcile the apparent dichotomy between:
- A view on gold which bullish both in the short and long term with ...
- ... A bearish short-term view for bitcoin coupled with a bullish perspective in the long-term.
Macroeconomic backdrop, demand and supply dynamic
1) 'Stagflation' as a central hypothesis is supportive of scarce assets such as bitcoin
The prior article of this April 2022 series articulated our central economic thesis of upcoming years of low/negative growth coupled with high inflation ('stagflation'). This is tied to the debasement of fiat currencies from 'money printing' as shown (see charts in this article). In this context, scarce assets are likely to be good investments. Bitcoin is a scarce asset by design.
2) The asset management industry is slowly opening up to bitcoin (or other cryptos). This shift implies increasing demand for bitcoin over the long term, once regulatory clarity is provided.
-
Select large companies started including bitcoin on their balance sheet in late 2020 and early 2021 (e.g. MicroStrategy, Tesla, Square). A list is maintained here.
-
Family offices and prominent investors (e.g. Paul Tudor Jones, Stan Druckenmiller) joined the fray
-
Large Wall Street firms started either recommending investors to consider a small allocation (e.g. JPMorgan Chase) or started facilitating and making possible such an allocation (e.g. BNY Mellon)
-
Large Wall Street firms are investing in the space e.g. BlackRock and Fidelity invested in Circle
-
Physically-backed ETFs tracking bitcoin or Ethereum are being or have been rolled out e.g. in Australia and in Canada. In the US, the SEC approved a handful of Futures-backed ETFs (i.e. not backed by bitcoin tokens but by bitcoin Futures) in late 2021. Fidelity even launched Metaverse ETFs.
3) Bitcoin is currently perceived as a 'risk-on' asset. It is, therefore, susceptible to fear. It is also likely to be brutally dumped if and when margin calls start hitting the stocks market as a result of central banks tightening 'just a little too far'.
Points 2 and 3 in this article explained why bitcoin can be seen as 'digital gold' i.e. as a store of value. I would argue that this argument holds despite its volatility if one has a multi-year view.
Recent events and the invasion of Ukraine have demonstrated -once more- the role of bitcoin as a personal store of value/wealth of last resort. I doubt Ukrainians fleeing their home can easily carry around gold bars or banknotes while crossing multiple military checkpoints. In the case of bitcoin, all one needs is 24 seed words that can be memorized, written on pieces of paper, sent to self in email, or any other creative and discrete option.
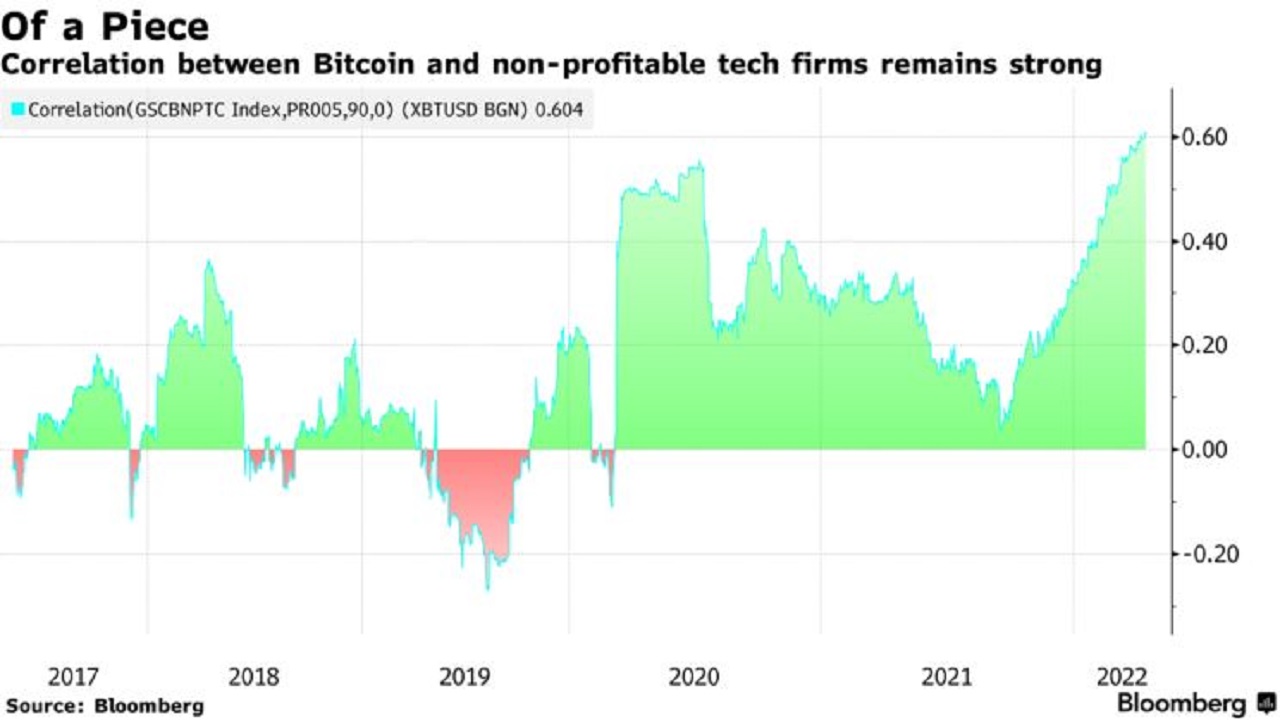
While the long-term proposition, value and robustness of bitcoin continue to be proven year after year, the market currently seems to treat it as a 'risk-on' asset in line with non-profitable tech stocks. The chart below shows how strong the correlation currently is. It is helpful to remember that the market can be wrong for periods of time but a long-term view introduces wisdom and corrects these exuberant excesses in favour of the right narrative.
Click here for a larger image (pop-up window)

Source: bloomberg.com
This means for us that bitcoin is very sensitive to fear and tightening actions from central banks. The first article of this series explained that, in order to try to fight inflation, central banks are likely to keep tightening (i.e. reducing asset purchases, raising interest rates) till something breaks. In other words, they will have to go one step too far to figure out the maximum action they can do.
That day, I would not be surprised if 'risk-on' assets experience a violent crash. It is also likely to trigger margin calls leading to a wave of selling everywhere. For example in March 2020, even gold experienced a significant sell-off. This was likely triggered by asset managers looking for liquidity in order to comply with margin calls on other assets e.g. stocks. This created a resonance phenomenon with almost all assets crashing indiscriminately.
Technical analysis
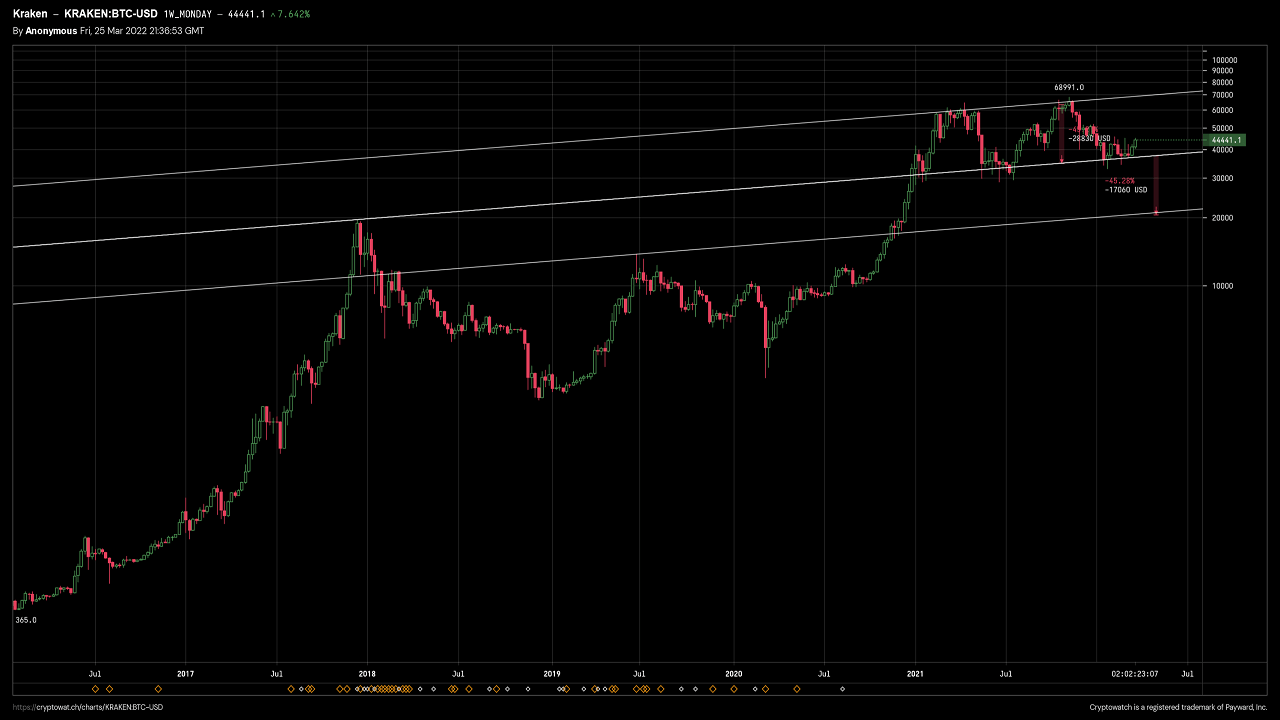
1) A double top pattern when plotting BTC/USD. Downside target: $20,000.
On the chart below, one can clearly see the double top pattern with a downside target of ~$20,000. This chart is plotted using a log scale to acknowledge the exponential nature of bitcoin price growth in the last ten years.
The three equidistant parallel lines are scarily surprising. The top of 2017 is support for the current price pattern and a clean break of this support line would send us straight 50% down -which happens to be the support line from the 2019 top. If this works, it would be one amazing feature of technical analysis.
Finally, it is also worth noting that if we were to plot the same chart on a usual/linear scale, we note that $20,000 is the horizontal support line from the 2017 top. What an amazing coincidence!
Click here for a larger image (pop-up window)

2) A double top pattern when plotting BTC in gold.
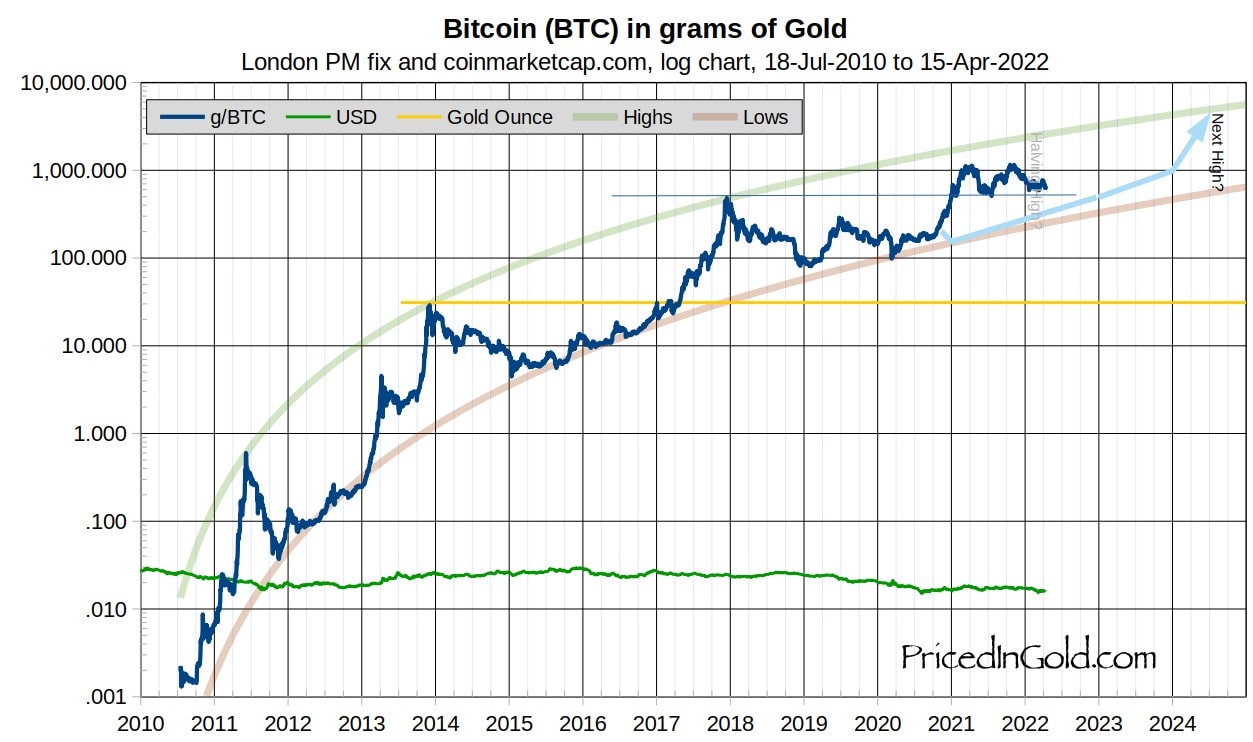
Since bitcoin is often described as ‘digital gold’, it makes sense to plot its price in grams of gold (or, alternatively, in ounces of gold). The chart below represents bitcoin priced in grams of gold since its early days in 2010.
We note the use of a logarithmic scale which makes sense since we are comparing a new and fast-rising asset (BTC) versus a well-established asset (gold).
Click here for a larger image (pop-up window)

Most interestingly, if we zoom in to the more recent period i.e. since 2014, we can observe a double top for the period 2021 to 2022 during which the price (in gold) was broadly halved from ~1,100g of gold per BTC down to ~512g.
This would imply an approximate downside target of ~250g of gold per BTC to complete the pattern.
Click here for a larger image (pop-up window)

As an additional bonus, we note on the BTC/Gold chart above that this ~250g target happens to match the curve of the lows as extrapolated from history.
This raises the question of the compatibility of this pattern with:
- The ~$20,000 downside target of the pattern on the BTC/USD chart as explained previously and
- The thesis detailed in the prior article stating that the $ price of gold is about to rocket up under my central macro-economic scenario of low/no growth and persistent inflation.
3) We can credibly articulate a scenario allowing gold to move above $2,000/oz while bitcoin crashes to $20,000 in the short term.
I have simulated below the resulting price of BTC in US$ when we vary the price of gold (rows) and the BTC/Gold ratio (columns). The darker the blue background, the closer the BTCUSD price is to $20,000. All numbers are approximate and hence rounded for clarity.
Click here for a larger image (pop-up window)

Amazingly, we see that:
If the double top on the BTC/Gold chart completes its downside target of about 250 and Gold is in the $2,000+/oz range as expected in the coming months, then we get BTCUSD prices in the vicinity of $20,000 (darker blue shade).
In other words, we have a credible scenario whereby we can reconcile three separate elements:
- Our central economic scenario of ‘stagflation’ and its likely impact on the $ price of gold (up in the short term and in the long term),
- The expected short-term downside target of the BTC/USD ‘W-top’, and
- The expected short-term downside target of the BTC/Gold ‘W-top’.
Wrap-up
This article points to a short-term scenario whereby bitcoin will crash to about $20,000. It might even crash further down for a brief period should margin calls, forced liquidations or a state of panic are triggered.
This scenario is the resulting analysis of the dual approach combining macro-economy and technical analysis. It is also fully compatible with gold rushing up above $2,000/oz in the next few months while bitcoin collapses.
Equally, it does not contradict a long-term multi-year bullish view of bitcoin.
It might be worth remembering the bitcoin proposition: scarcity, portability, robustness, censorship resistance, and base layer for further technologies delivering at scale (e.g. free instantaneous payments via The Lightning Network or Liquid, automated contract settlement via Discreet Log Contracts, etc)
Finally, it is worth wondering what would invalidate this short-term scenario for bitcoin:
- BTC exceeding the recent double-tops in US$ or grams of gold. This would invalidate the patterns and the downside target.
- Central banks managing a soft landing of the economy while taming inflation. Probably as close to magic as one can get.
- The asset management industry replacing gold by its digital version (bitcoin) in their asset allocation in the next few months. This would create significant additional demand for bitcoin and drive the price up. It is however unlikely in the short-term as regulatory and legislative clarity needs to be provided first, and it will take some time (years?).
We can also wonder what would happen if gold does not manage to break above its recent highs of ~$2,060/oz. In this case, bitcoin could go much lower as per the table above.
