April 2022: gold is about to lift-off

18 April 2022
The case for investing in gold
In this analysis, we will use a dual approach combining macro-economic analysis and technical analysis.
1) The macro-economic analysis gives us the direction of the move and the confidence to wait for it.
2) The technical analysis gives us probabilistic information on entry points and on the magnitude of the move
Finally, before we start, it is important to remember that gold is a scarce asset: the amount of additional gold extracted from the Earth is about ~2% per annum and only a small fraction has industrial use. By comparison, silver has much more industrial use which means that the price of silver also varies depending on the business climate. In this way, gold is a 'purer' play.
Macroeconomic backdrop
1) 'Stagflation' as central hypothesis
The prior article of this April 2022 series articulated our central economic thesis of upcoming years of low/negative growth coupled with high inflation ('stagflation'). This is tied to the debasement of fiat currencies from 'money printing' as shown (see charts in this article). In this context, scarce assets are likely to be good investments.
2) The asset management industry is likely to shift to holding more gold due to real negative returns in bonds
The asset management industry is a large buyer of public bonds e.g. US bonds, UK gilts etc. This is both a regulatory constraint and a choice.
It is a regulatory constraint. For example, life insurers must ensure a sufficient allocation to low-volatility and 'safe' assets. These regulations are there to ensure that life insurers keep their end of the deal i.e. pay claims when the time comes.
- This means that they need to be still in business decades later when a life insurance claim is raised as these contracts typically span over many years.
- This also means that they must pay the amount contractually promised in a timely fashion and at a time that is not known in advance (e.g. the time of death of the policyholder is not known when signing the contract). This means that a significant pocket of investment must be ready for disbursement and cannot be locked up in e.g. 10-year Private Equity investments.
It is a choice. Asset managers have degrees of freedom in the 'safe' assets they choose and much they allocate. Some have more freedom than others: life insurers have less leeway, and wealth managers have more freedom. For decades, many wealth managers have used the 60/40 allocation i.e. 60% in equities and 40% in bonds. The idea was that the bond pocket provides low, steady and uncorrelated returns and the equity portion gives a long-term boost albeit with some volatility.
The problem of course today is that any bond allocation gives negative real returns. Professional asset managers are therefore guaranteeing their clients a straight loss of purchasing power by investing in bonds (and they get paid for it!). This is hardly a great customer proposition and -at some point- customers will notice.
The new narrative of central banks gives asset managers a few months to adjust and think about what to do. For the moment, the message is: "don't worry Mr/Mrs Smith, central banks said they will aggressively fight inflation. You are currently paying me to consistently lose money but it will not last too long". This gives time for large organisations with both huge Assets under Management (AuM) and large bureaucratic structures (e.g. 'investment committees') to sharpen their business answers. In my own experience, the decision-making process lasts 3 to 12 months before any allocation shift may be initiated.
The most likely outcome of these strategic decision-making processes will be to diversify away some of the loss-making bonds into other relatively 'safe' assets with better return expectations. Gold appears as a prime candidate. It has indeed served humans well as a store of value or a transaction medium since about 700 BC.
3) Central banks and the asset management industry are likely to shift to assets with more custodian control (e.g. physical gold in chosen vaults) as a consequence of the war in Ukraine
Russia has discovered at its own expense that owning an asset is not the same as being the custodian of this asset.
The Russian Central Bank has $634bn of foreign exchange (FX) reserves to support the ruble and its economy. But these are not physical certificates of government bonds or truckloads of cash in dollars, euros, pounds or yen. They are electronic book entries on the computer ledgers of the Federal Reserve Bank of New York, the European Central Bank, European national central banks, the Bank of England, the Bank of Japan and Swiss commercial banks.
As part of the sanction package related to the invasion of Ukraine, these central and commercial banks froze these assets and banned the Russian central bank from accessing them. In practice, this meant that Russia lost access to 60% of its FX reserves i.e. lost access to $388bn out of a total $643bn. The Russian central bank is apparently left with $135bn worth of gold in its vaults, $84bn of Chinese securities denominated in renminbi, a $5bn position in the IMF and a residual $30bn in actual cash, dollars and euros. On top of that, they can't even sell their gold for Euros or Dollars since these transactions have also been prohibited by Western sanctions.
For more details, I recommend reading through this excellent FT article from which these numbers are sourced.
Yet, Russia could have learned from history and particularly from the action of the French and British in 1971.
Prior to 1971, the "Bretton Woods" system meant that the US$ was pegged to gold with the US$ directly convertible back into gold. In 1971, after years of massive $ monetary inflation ('money printing'), it became clear that the peg was no longer sustainable. On 15 Aug 1971, US President Nixon suspended the convertibility of the dollar into gold and ordered the gold window to be closed such that foreign governments could no longer exchange their dollars for gold. This decision was made without consulting members of the international monetary system and was dubbed the Nixon Shock.
However, prior to the event, France requested the conversion of -at least- $191m in gold to be sent back to France for custody. France actually did send a warship to New York City in Early Aug 1971 to physically remove the gold from the vault of the New York Federal Reserve (and possibly to make the message clear). The British also requested a massive $3bn worth of gold to be transferred away from Fort Knox. Apparently, they did not send a warship. More details can be found here and here.
The point here is that 2022 is not the first time that history points out the difference between owning an asset and being the custodian of an asset. One can also ask citizens of many countries about their experience when they were suddenly locked out of their bank accounts while the government decided to massively devalue the currency overnight (e.g. Argentina). Bitcoin aficionados will recognize here a major tenet of this virtual asset: self-custody (coupled with scarcity).
In any case, what this means for us in 2022, is that central banks and other financial players would have taken note and will mechanically decide to own more of their reserves or assets in a way where they can self-custody or custody in vaults of their choosing. This is not favourable for bonds (which are just electronic records nowadays), but it is of course very favourable for (physical) gold. Central banks and large players will certainly want more of it in the next few years, thereby driving the price up (since the supply is limited).
Technical analysis
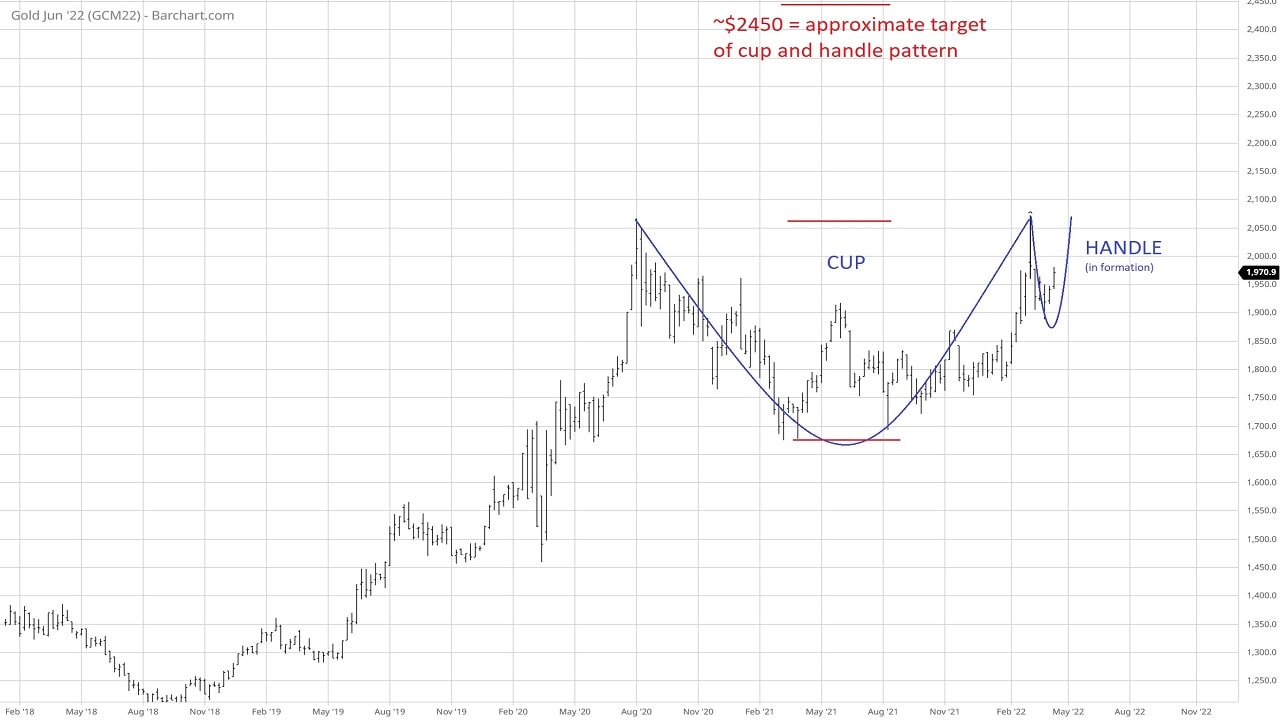
1) Cup and handle pattern from 2020 to 2022
Gold is drawing a quasi-perfect cup-and-handle pattern starting in Aug 2020. As of this writing, it is forming the handle. Should the pattern completes, it points to a target of about $2450.
Note that the Gold Futures continuation chart is back adjusted using contract rolls one day prior to expiration.
Click here for a larger image (pop-up window)

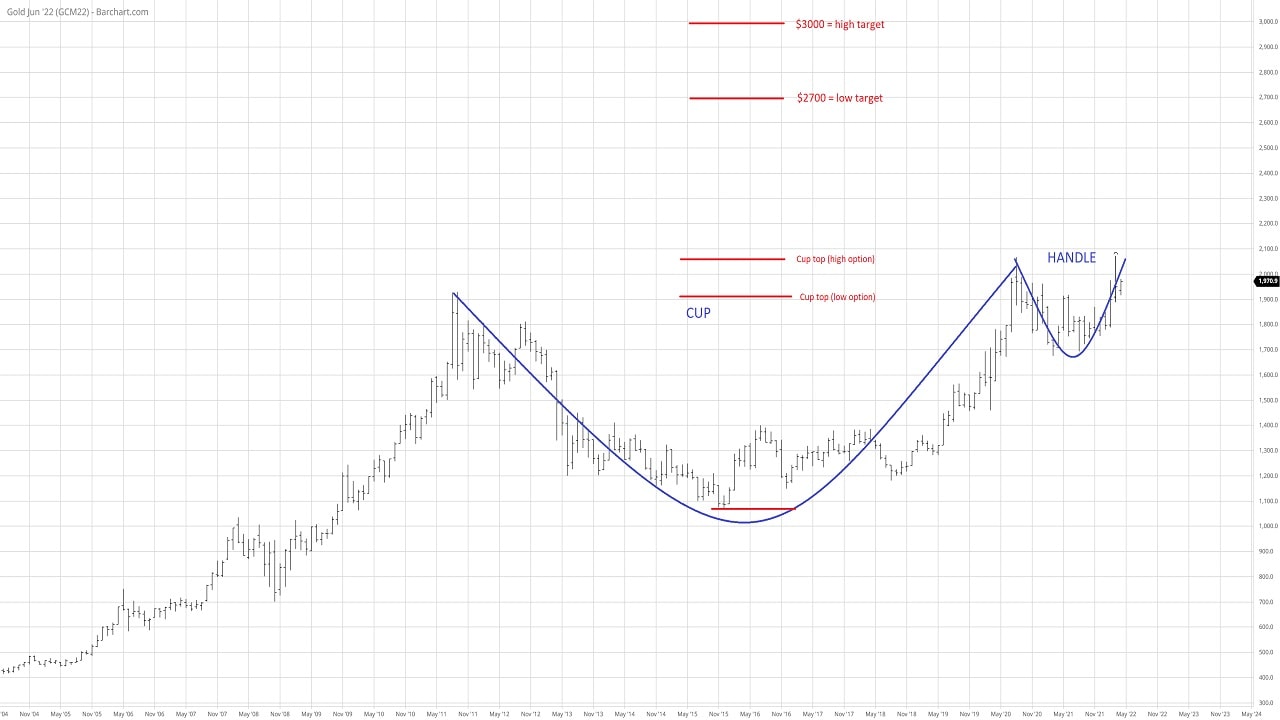
2) Cup and handle pattern from 2011 to 2022
One could argue that gold is also exhibiting another approximate cup-and-handle pattern dating back to 2011. The tops are not perfectly aligned but it does add an element of confidence to the overall thesis. The target of this cup-and-handle is about [$2700 - $3000].
Note that the Gold Futures continuation chart is back adjusted using contract rolls one day prior to expiration.
Click here for a larger image (pop-up window)

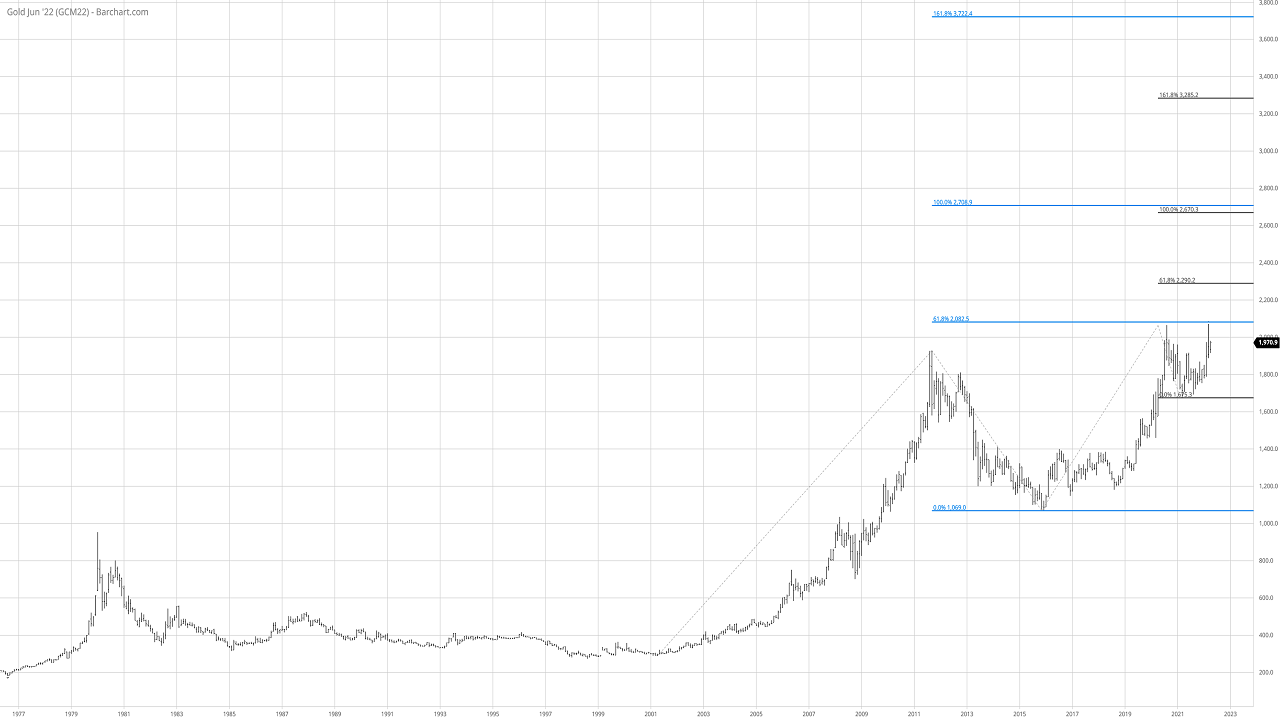
3) DiNapoli targets (Fibonacci levels)
Joe DiNapoli came up with specific use of certain Fibonacci levels both for retracements and extension. In particular, when two target levels are aligned (said to be 'in confluence'), it has a higher probability to be a strong point of resistance or support.
While this is in no way an endorsement, I found it helpful to give a possible idea of things to come. For example, the retracement from Aug 2020 to the low of 2021 (i.e. the low of the cup of point 1 above) turned out to be exactly the 38.2% retracement of the major low of 2015 to the major high of 2020.
Using this approach for possible upcoming price targets, we get several targets:
- A resistance at ~$2300
- A strong resistance ('confluence') ~$2700
- A resistance at ~$3300
- A strong resistance at ~$3700 arising all the way from the price action initiated in 2001.
Note that the Gold Futures continuation chart is back adjusted using contract rolls one day prior to expiration.
Click here for a larger image (pop-up window)

Technical analysis summary
We have gained a few insights from the technical analysis above:
1) There is no target/resistance lower than $2300. This gives us a feel for reasonable mid to short-term 'minimal' expectations. With gold priced at $1950 as of this writing, this is a gain of ~18%
2) We can expect some resistance/consolidation in the $2300 to $2450 area
3) We can expect a major resistance and consolidation when hitting the $2700 area (DiNapoli confluence + low target for the 2011-2022 Cup & Handle pattern). Likely with a pullback of significance.
4) It is not silly to hope that gold will rise up to $3300 or even $3700 with a multi-year horizon.
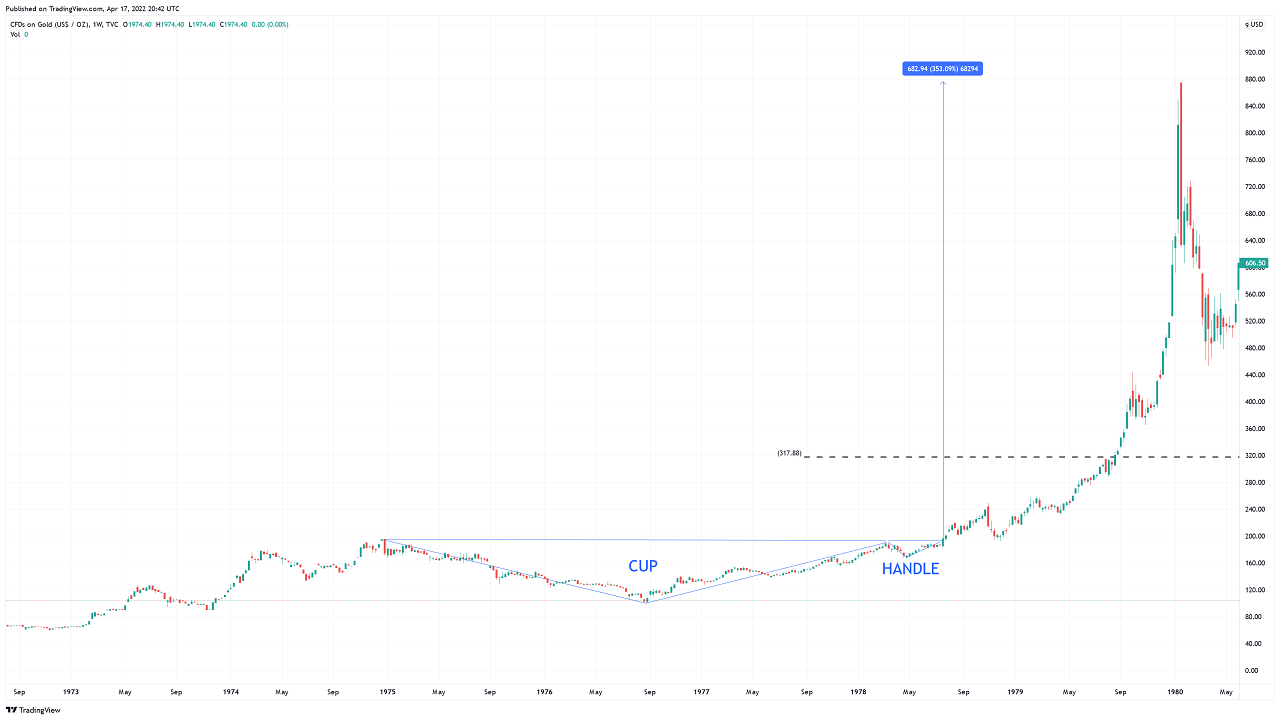
To put things in perspective, we can compare the 2020s to the 1970s.
- At the time, and at a similar point in the Cup and Handle pattern (1975-1978), gold ended up rising 350% from the top of the cup. This would mean reaching a price >$9000 in the next few years ($2070 x (1+3.53)).
- We note as well that the most outlandish of the DiNapoli target/resistance at the time (~$320 black dotted line on the chart below) was hit with a pullback, before rising exponentially to extraordinary heights.
All we need for exponential growth is FOMO to reach the large market participants. This is not impossible.
Click here for a larger image (pop-up window)

Wrap-up
We have seen that combining macro-economic and technical analysis gives us a positive view of gold.
Target gains from today (gold at $1950) could deliver as low as +18% (gold @$2300) or as high as +350% (gold >$9000) should FOMO and an exponential growth 'a la 1970s' were to happen.
One could argue that a reasonable target may be about +50% (i.e. price hitting around $2700 to $3000). This would be both near the target of the 2011-2022 cup & handle as well as the DiNapoli confluence level.
Next Steps
The next article will look at bitcoin. Very much like gold it is a scarce asset. Indeed, it is programmatically limited to 21 million and hence is therefore often presented as 'digital gold'.
However, both assets are not the same and are likely to behave very differently in the short term. The next post will articulate the thesis that while gold should make new highs in the short and long term, bitcoin could first drop to $20,000 or below in the next few months before reaching new highs in the long term.
