April 2022: stagflation incoming...
10 April 2022
Macroeconomic backdrop
Back in Spring 2021, we pointed out in a couple of articles that scarce assets would perform well on the backdrop of the huge monetary stimulus triggered as a response to the Covid pandemic. These extra Dollars, Euros or Pounds (called 'fiat' currencies) are chasing a quantity of goods, assets and stores of value that has not increased as fast or has not increased at all. As a result, one could expect asset price inflation (e.g. stocks) and/or consumer price, commodities and raw materials inflation (e.g. wheat, bread) and/or scarce assets inflation (gold, bitcoin, real estate).
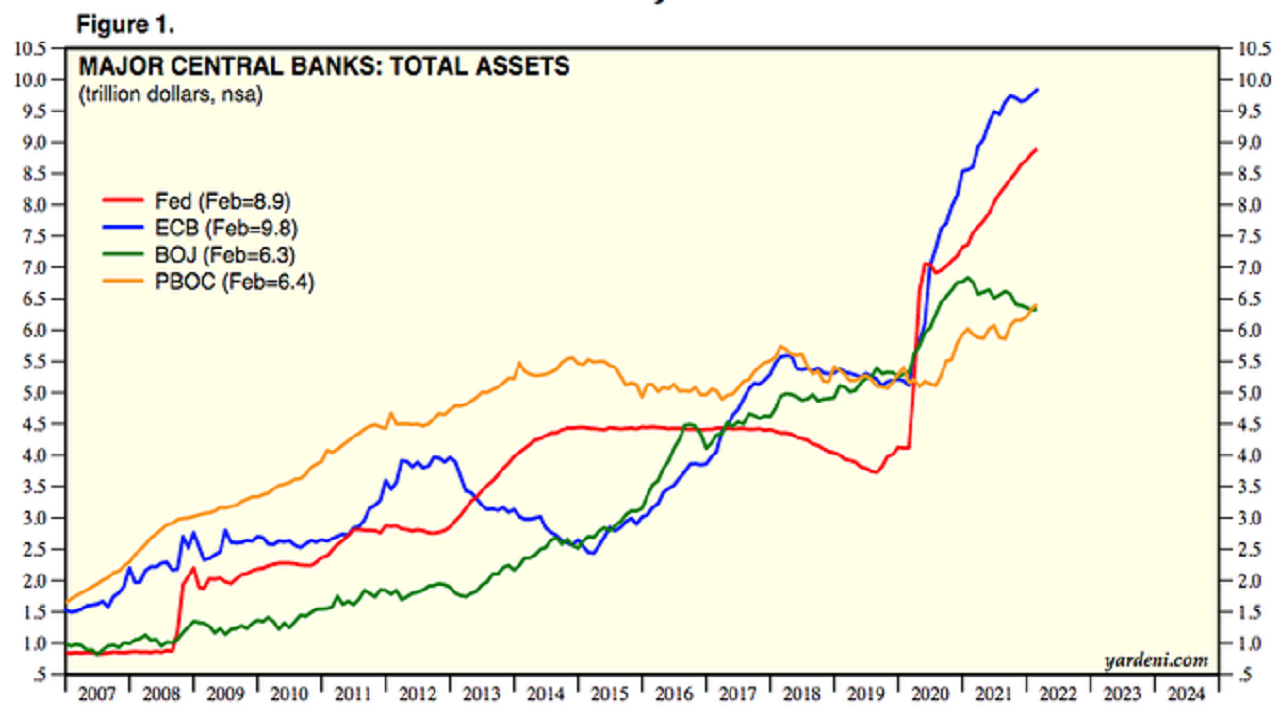
The chart below shows the continued increase in the balance sheet of the major central banks.
Click here for a larger image (pop-up window)
Source: yardeni.com
Simplifying a bit, this is the result of central banks buying assets in exchange for (often) newly created units of currencies such as Dollars, Euros or Pounds thereby injecting fresh 'fiat' currency into the economy and creating monetary growth.
- For example, the government (e.g. the Treasury) emits new bonds which the central bank immediately buys with newly created currency units. This 'fiat' money is created out of thin air and suddenly appears in the economy.
- Central banks can also buy relatively illiquid and low-quality securities from banks (e.g. Mortgage-Backed Securities shortened as 'MBS') in exchange for fiat (newly created or existing). This reinforces the banks' capital structure, making them more robust and allowing them to participate more actively in the economy via e.g. mortgage lending. Needless to say, most of these assets are not worth much so this is a way to get the banks out of trouble. In theory, this was in exchange for propping up the economy via e.g. lending. In practice, in the early 2010s, banks used this fresh cash injection to meet more stringent capital requirements and could therefore not reinject it into the economy via e.g. lending. As a result, QE (Quantitative Easing) in the 2010s turned out to be a way to transfer bad debt from regular banks to central banks but did not reach the 'real' economy.
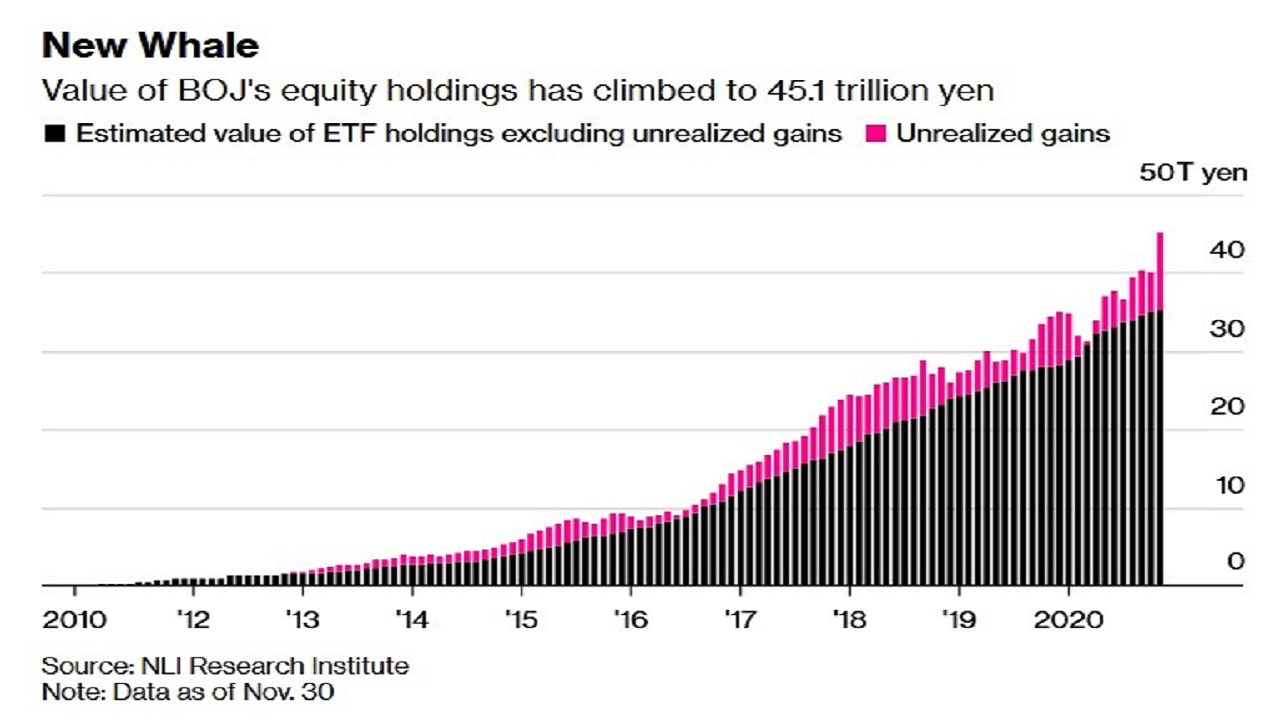
- Finally, central banks can also directly prop up the stock market and buy equities with "money printed out of thin air". As of Dec 2020, the BoJ was directly holding more than US$400Bn of Japanese stocks and was the biggest equity holder in Japan. As a result, people have their equity assets go up, feel richer and continue to live, spend and invest as in "good times".
Click here for a larger image (pop-up window)
Source: bloomberg.com
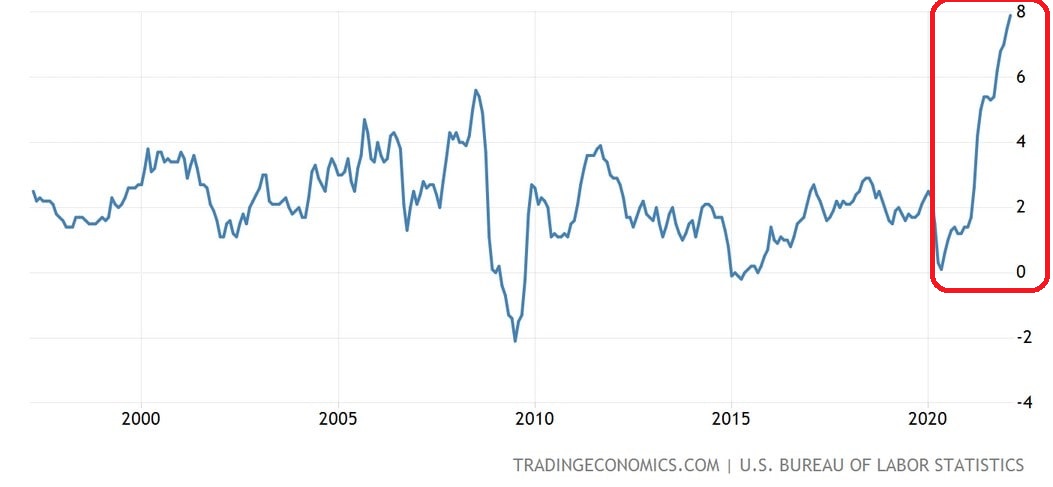
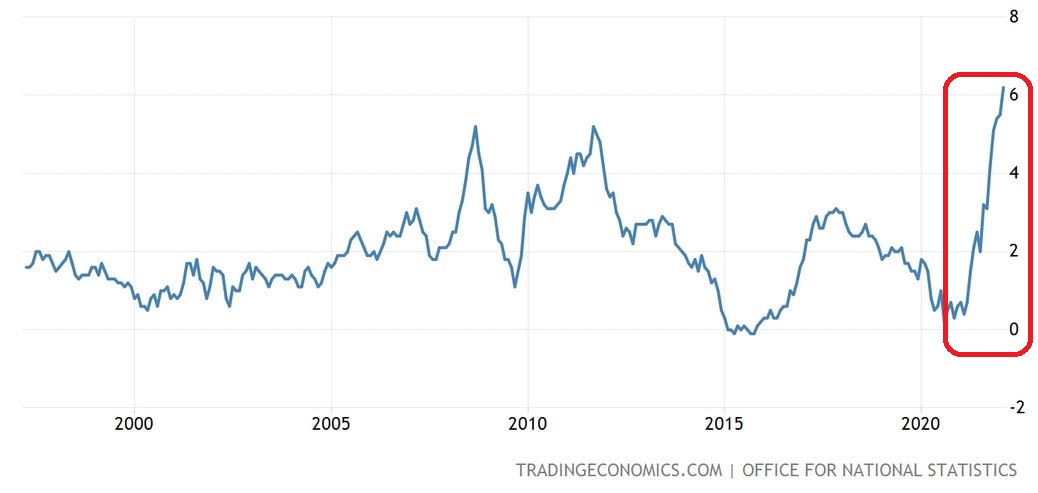
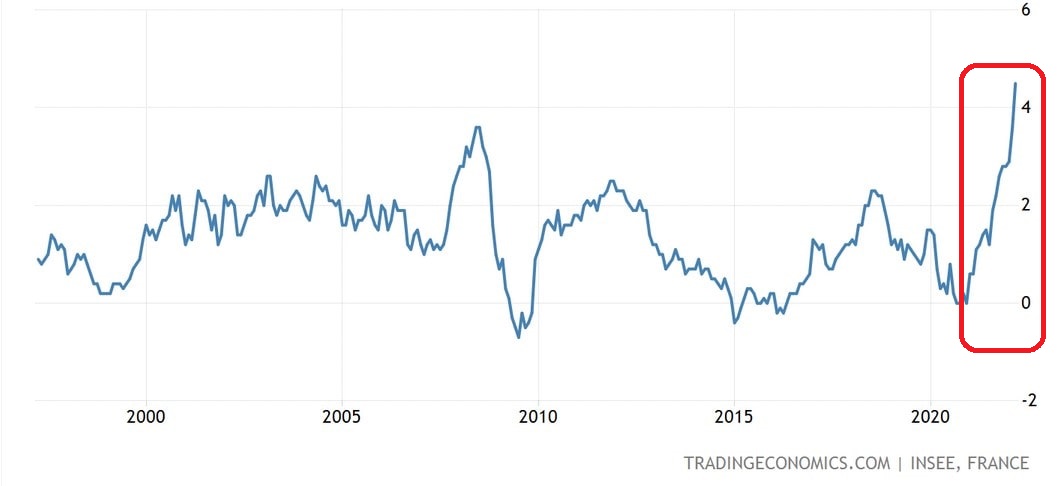
For most of 2021, the main central banks (e.g. FED, ECB, BoE) tried to use the narrative of ’transitory inflation’ to distract the markets from the truth. One could argue that it worked for some time as gold -a historical inflation hedge- spent ~18 months consolidating. Sadly for our central bankers, it only delayed the inevitable. As an example, the charts below show the US, UK, and France's official Consumer Price Index (CPI).
US CPI inflation
UK CPI inflation
French CPI inflation
We note that there is justified strong debate on how well these numbers measure the inflation truly experienced by consumers. It is indeed in the interest of governments worldwide to have this number minimized since multiple government expenses are automatically tied to CPI e.g. state pensions or part of the public debt. As a simple punctual example here in the UK, cell phone companies have adjusted their subscription plans in April 2022 by CPI + ~4% and not just by CPI.
In my opinion, real inflation numbers are more likely to be in the double-digit % range in most Western economies.
Nevertheless, one can see why the ’transitory inflation’ smoke screen had to be dropped in late 2021 for fear of sounding ridiculous.
Faced with overwhelming and undeniable evidence, central bankers recently started singing a different tune vowing to fight inflation by aggressively raising rates and reducing various asset purchase programs. This is yet another attempt to distract markets and citizens/voters alike.
-
Central bankers and treasury departments need to push the storyline of an aggressive fight against inflation to the markets.
Indeed, the alternative story (and the truth) is that inflation will remain on average high enough to be well above public bond yields for the next 5 or 10 years. In other words, the current situation will continue. Therefore holding bonds in real terms means losing purchasing power i.e. losing money. Consequently, nobody would want to keep or invest in such a bond.
Hence, the narrative pushed by central banks and governments is "don't worry, we will bring back inflation down by raising interest rates so that public bond yields are above the inflation rate in nominal terms i.e. deliver a positive return in real terms". Somehow and exactly like for the 'transitory inflation' narrative, it gets some traction with pundits interviewed on Bloomberg and elsewhere. They should know better. We will see why in the next section.
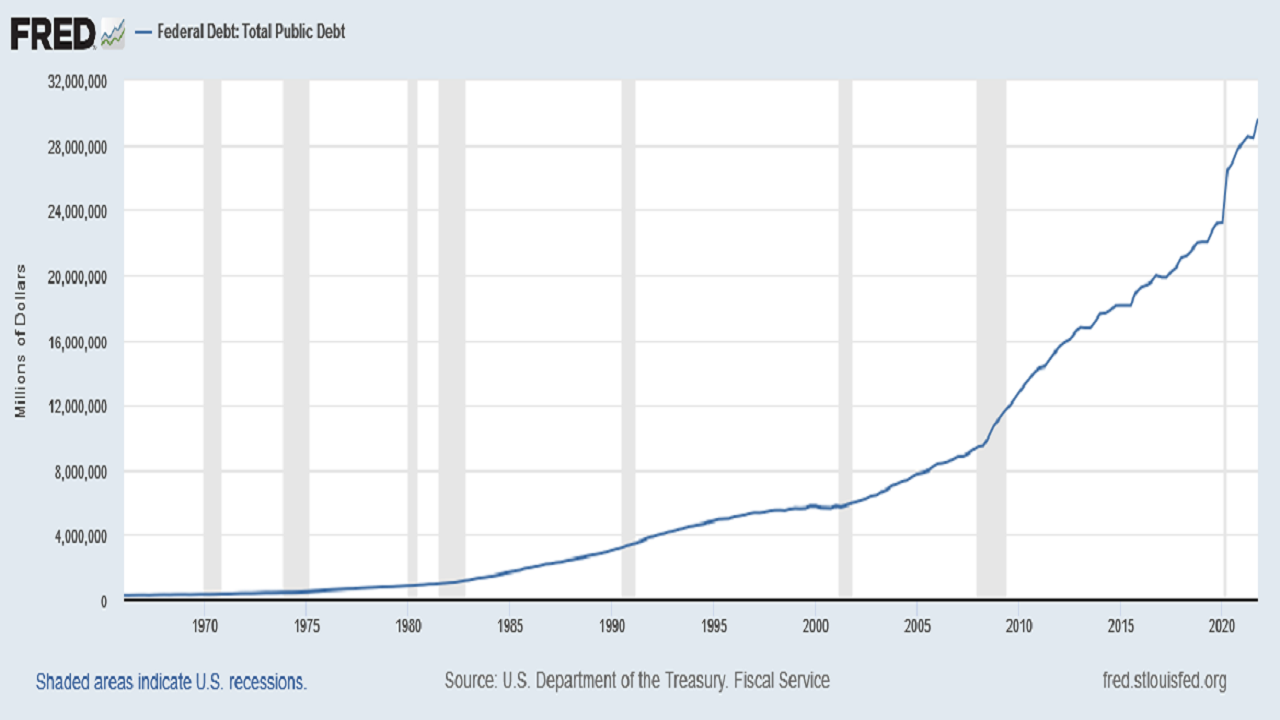
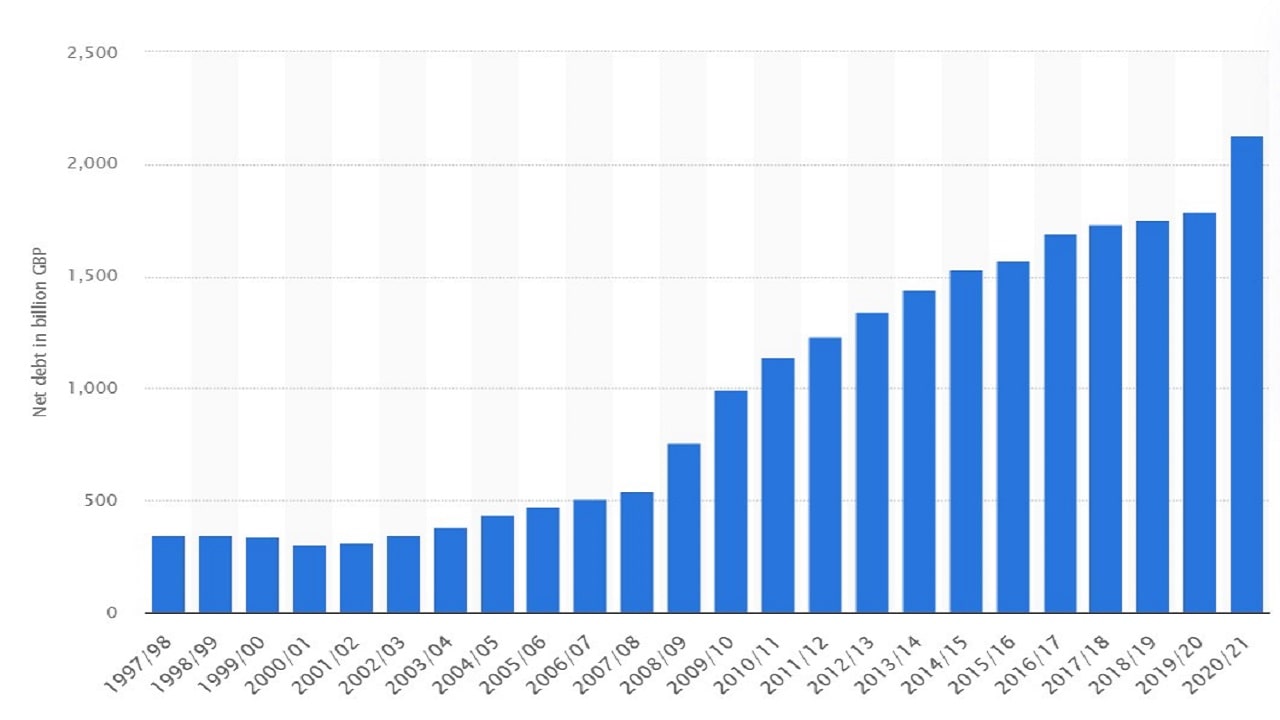
For the moment, we will note that it is of great interest for treasury departments to have inflation higher than bond yields. It allows the deleveraging of public debt without officially defaulting: bond payments (including the principal) are made nominally but since the purchasing value of the currency is reducing over time (because of inflation), this gives a real-term default because the investor is not made whole (in real terms).
Source: statista.com
-
Politicians also need to be seen as aggressively tackling inflation.
The cat is out of the bag and voters have noticed that prices are significantly up (food, petrol, rent, etc). Politicians are therefore concerned for their own future and we can see a flurry of promises to control the cost of living. The French presidential election is interesting in that regard and so are the various claims made in the UK and the US.
The reality, of course, is that many drivers of inflation are global and beyond the control of any single country. Petrol is a good example. Most western governments do not have control over oil prices as the majority are not oil producers. What they control is the petrol tax. But of course, cutting this tax down means less public revenues, meaning either more public cost-cutting (i.e. less healthcare, defence, or education), finding more taxes elsewhere, or borrowing more in a context where public debt
Four good reasons why central banks cannot really fight inflation in the early 2020s.
1) Raising rates also means raising the cost of national debts i.e. the $, £ or Eur amount of regular payments needing to be made towards servicing national bonds, gilts, or treasuries.
This implies that raising rates leaves less money available for education, healthcare, defence, police, etc. There are only three possible options as consequence:
- More debt can be raised to pay for these things but this action defeats the purpose: it will mechanically increase the cost of servicing the (further increased) debt.
- Politicians can slash costs and reduce budgets allocated to public services (e.g. in education, defence, police, etc), but this is unlikely to get them reelected.
- Politicians can also increase taxes but it is not a very palatable option either.
In summary, some attempts will be made with targeted tax increases and budget cuts but they have to be limited in scope and depth if any political leader hopes to be re-elected. We will also likely see debt increases as this option is quiet and not really seen by voters.
We will look below at the UK public debt and use it as an illustrative example to show why central banks cannot raise rates because of the extra burden of servicing the public debt.
The majority of the UK debt payment is linked to bond yields and not to inflation.
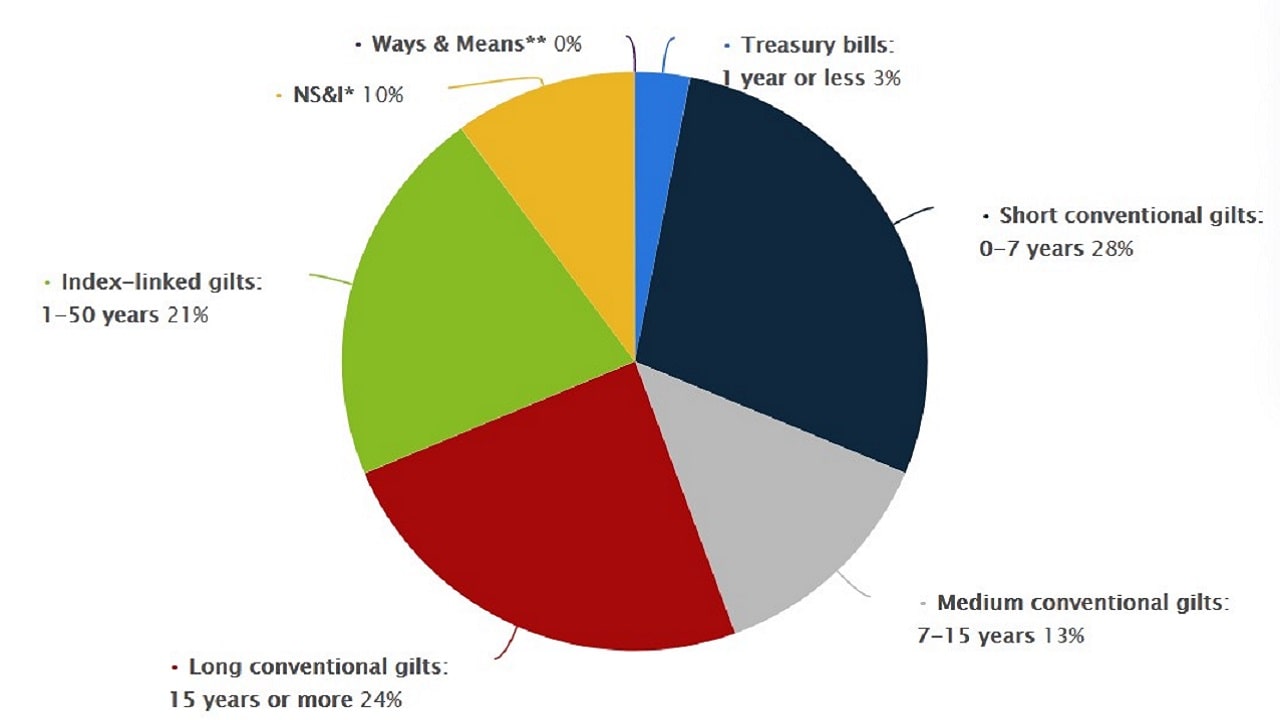
Source: statista.com (Dec 2020 data)
- About 30% of the debt is linked to inflation i.e. NS&I and index-linked gilts. The higher the inflation, the higher the debt payments (NS&I are National Savings and Investment products i.e. a range of savings and investment products backed by HM Treasury which are offered to retail investors).
- However, about 70% of the debt repayment is tied to bond yields (bonds are called gilts in the UK). These yields are normally determined by a combination of the BoE base interest rate and the free market. When the BoE hikes its base interest rate, the whole yield curve tends to move up. This obviously makes 70% of the UK debt repayment more expensive.
Let us do a 'back-of-the-envelope' calculation to understand orders of magnitude and subsequent limitations.
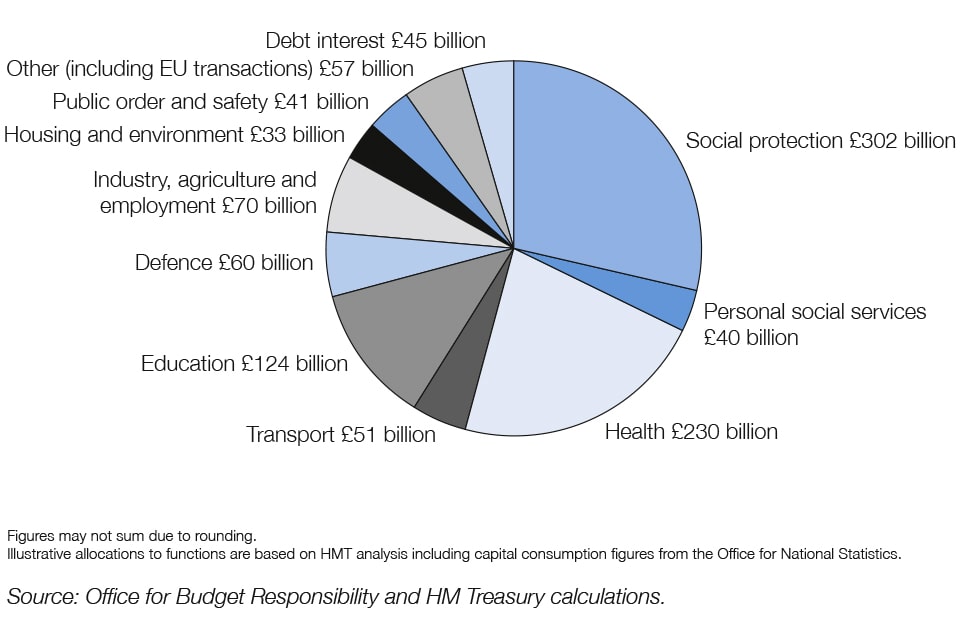
The chart below from the UK 2021 budget shows the expected national debt servicing cost at £45Bn. The UK public sector net debt is at about £2,300Bn (Feb 2022). In ballpark terms, this means the UK national debt is serviced at ~2% interest rate (45 / 2300) assuming a BoE base interest rate of 0.1% as it was at the time when this budget was built.
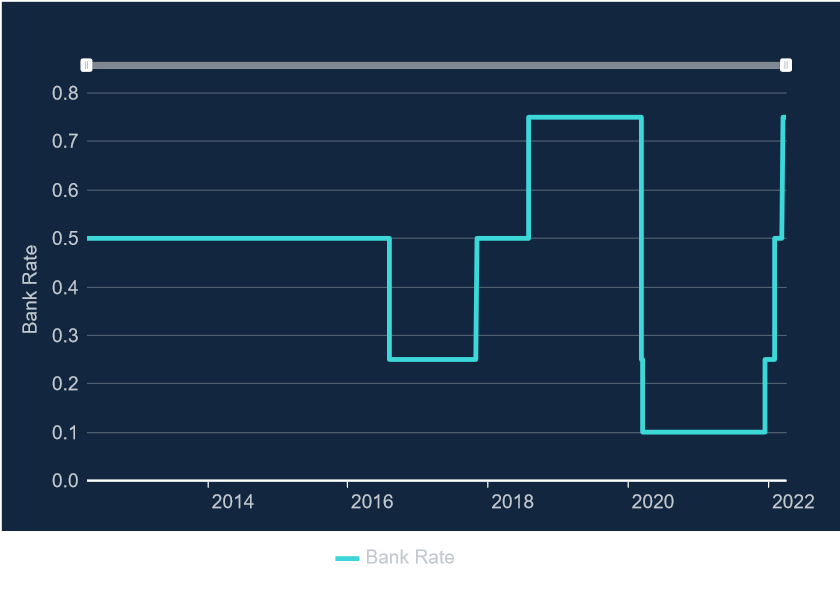
The BoE bravely raised its base interest rate from 0.1% to 0.25% on 16 Dec 2021, then to 0.5% in Feb 2022 and finally to 0.75% on 17 March 2022.
So, what happens if the BoE raises its base interest and if we assume that a similar increase is 'transmitted' all across the UK yield curve?
- With the base rate increased from 0.1% to 0.75% (base rate as of this writing), then the £45Bn in debt interest becomes £60Bn (2,300 x (2% + (0.75%-0.1%)))
- With the base rate increased at the level of the 2% government annual inflation target, then the £45Bn in debt interest becomes £90Bn (2,300 x (2% + (2%-0.1%%)))
- With the base rate increased at the level of the March 2022 inflation level of 6.2%, then the £45Bn in debt interest becomes £186Bn (2,300 x (2% + (6.2%-0.1%)))
- With the base rate increased at the level of 1979 (to tame the high inflation of the 1970s) @17%, then the £45Bn in debt interest becomes ... £430Bn (2,300 x (2% + 16.9%))
So, when looking at orders of magnitude and without going into the detailed debt structure and maturity, we get a feel for the limits attached to trying to 'aggressively' raise the base interest rate.
- At 2% base rate, and without any other change (not increasing taxes or not increasing debt), the equivalent of one of the 'public order and safety', the 'housing and environment', or the 'personal social services' budgets is wiped out. What is interesting is that a 2% base rate is not even high at all. Those of us in Financial Services pre-2008 will remember rates in the 5% or even higher range at the time.
- Raising the base rate even higher becomes borderline ridiculous as shown with a rate matching the March 2022 inflation at 6.2%.
- Finally, a historical comparison is helpful. To tame the high 1970s inflation, the BoE base rate in the late 70s and early 80s was in the ... [12% to 17%] range. As calculated above, one can see that it is simply impossible today.
We used the UK as an example but the situation is exactly the same in all developed countries.
In summary, we can see that the narrative of an 'aggressive' rise in interest rates to fight inflation has no bite.
2) Raising rates also makes the cost of financing (i.e. the cost of servicing debt) higher for individuals and corporations alike in addition to already higher costs of goods and services (inflation!).
As a result, some holidays will not be booked, some new car purchases will be postponed, some expenses will not be made, some investments will not be approved, and, consequently, the growth of the economy will slow down and even start to contract if interest rates go high enough.
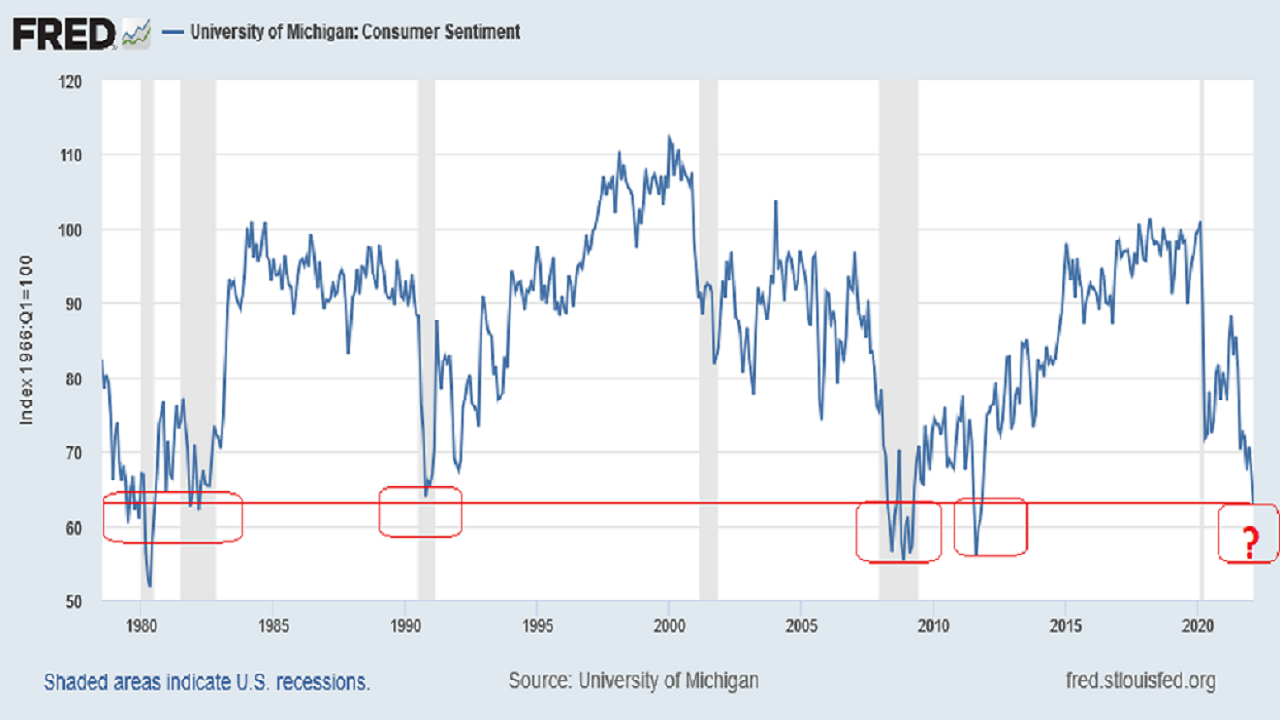
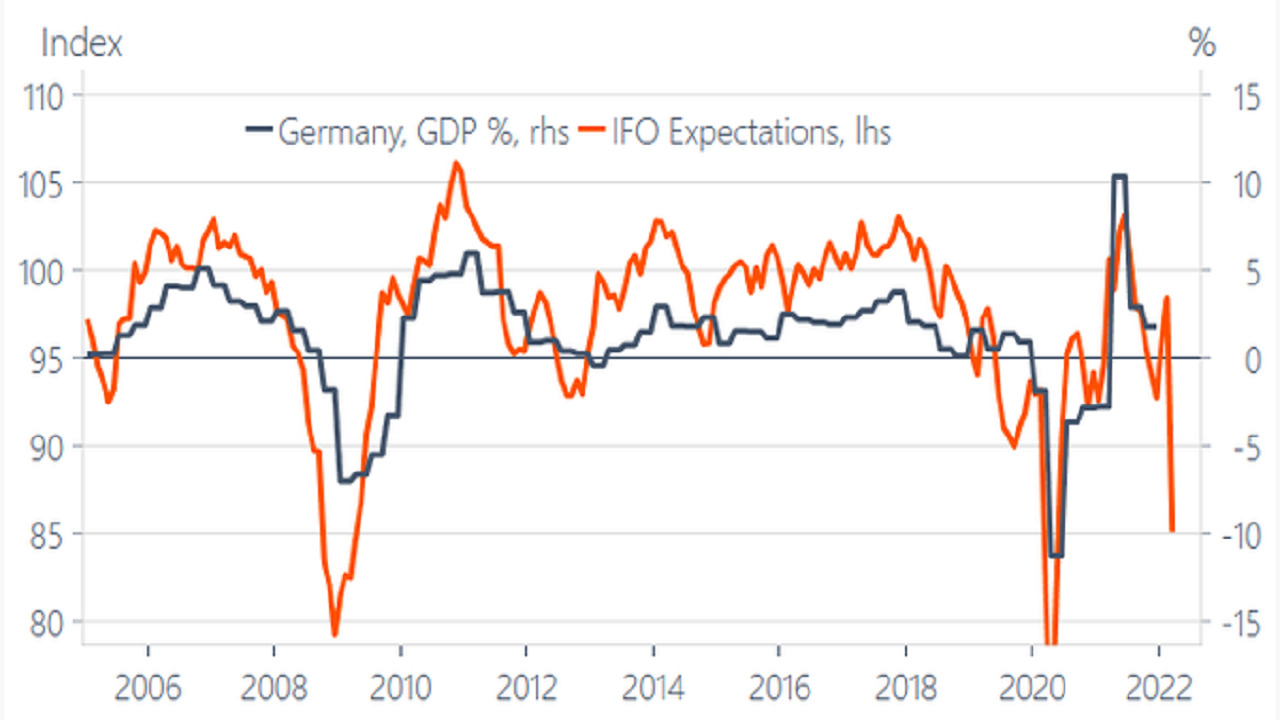
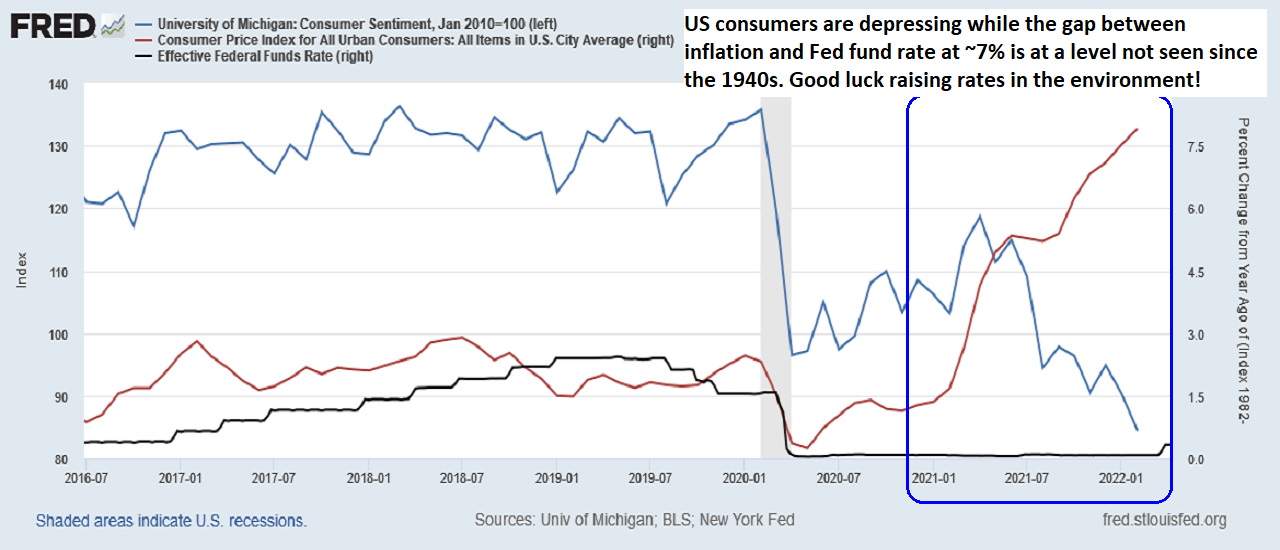
Indeed, early indicators already point to recessions. Below are the US and German examples.
The US Consumer Sentiment Index is at a level typical of recessions (shaded areas)
3) The stock market started pricing somewhat higher interest rates, leading to shrinking market capitalizations in recent months. This drags the overall market valuation down and hence the wealth (or perceived wealth) of investors and therefore their spending enthusiasm.
We, therefore, have yet another limitation to interest rate rises which will be dictated by the fall in the market capitalization of stock markets and therefore of wealth, retirement and other savings held by individuals and companies alike.
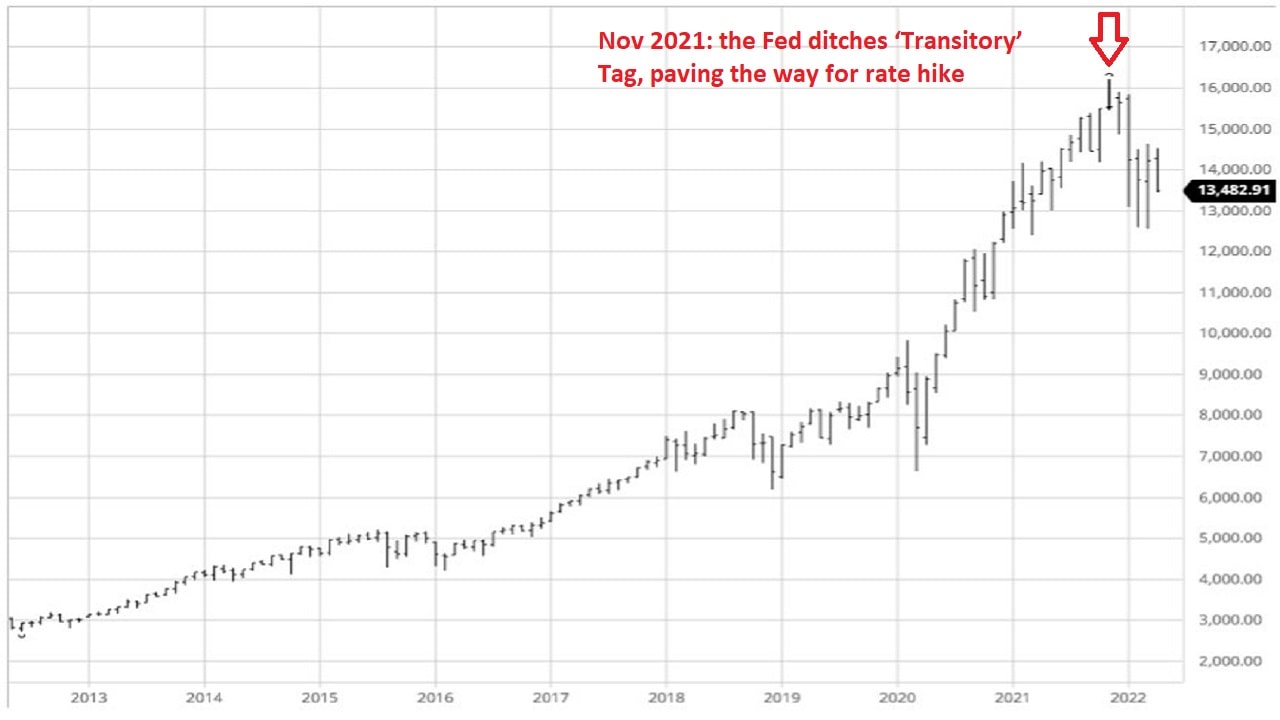
Source: Bloomberg article

Source: Bloomberg article
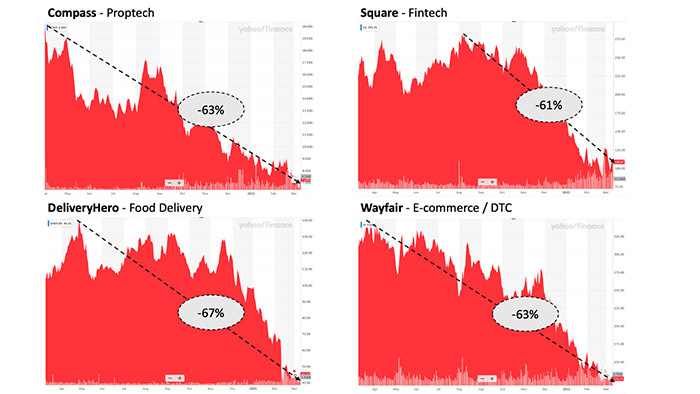
While all stocks are penalized by higher interest rates, we note that companies rich in ambition and poor in profits are particularly impacted. Indeed, when one values a company, i.e. applies some form of the Discounted Cash Flow method, businesses with hypothetical returns far in the future are significantly more impacted, than boring businesses with regular recurring cash flows.
Low profit or loss-making stock examples
Source: fabricegrinda.com
4) On top of the covid-induced supply-chain challenges, the war in Ukraine and subsequent economic sanctions against Russia will not only penalize Russia but also the world economy.
In the last 30 years, the global economy has been built around efficiency and cost-effectiveness and not for resiliency. Those of you who have studied in B-schools in the 90s or early 2000s would remember classes such as 'lean management', 'just-in-time production', etc.
The Covid crisis has highlighted how interdependent and interconnected the global economy is. When all economies started reopening at the same time, problems followed. The demand for commodities and raw materials exploded from a low covid-time base, the demand for production output (typically in Chinese or South-Asian factories) largely exceeded capacity, and the demand for transportation (e.g. containers, boats, planes etc) also exceeded the available capacity. And when demand exceeds supply, the adjustment variable is price.
The war between Russia and Ukraine added another layer of supply shortage. They are both major producers of raw materials, grains, fertilizers, along with oil and gas. With supply being therefore further reduced, we will see both an increase in cost and reduced output for products made using those supplies (as a result of making the final products not economically viable if there is reduced demand at a higher price point). This will compound inflation further and puts a further drag on global growth.
Summary
We have seen four reasons why central banks have limited scope in raising interest rates. While they are clamouring to aggressively fight inflation, they are limited in how much they can do i.e. they can increase rates a little (1%? 2%? 3%) but nowhere near enough to match YoY inflation in the [7%-15%] range depending on the country and on the numbers you choose to believe. This means that holders of national debts will lose money in real terms even if they are fully paid back in nominal terms (the value of the $, £ or Eur debt payment gets eroded by this particularly large inflation over time so that $100 in one year buys you less than $100 today).
Summary chart for the US: with consumers already depressing, raising rates enough to plug the inflation gap w/o triggering a recession is impossible.
Germany is not doing much better in the context of the ifo expectations indicator already predicting a recession as per the chart above
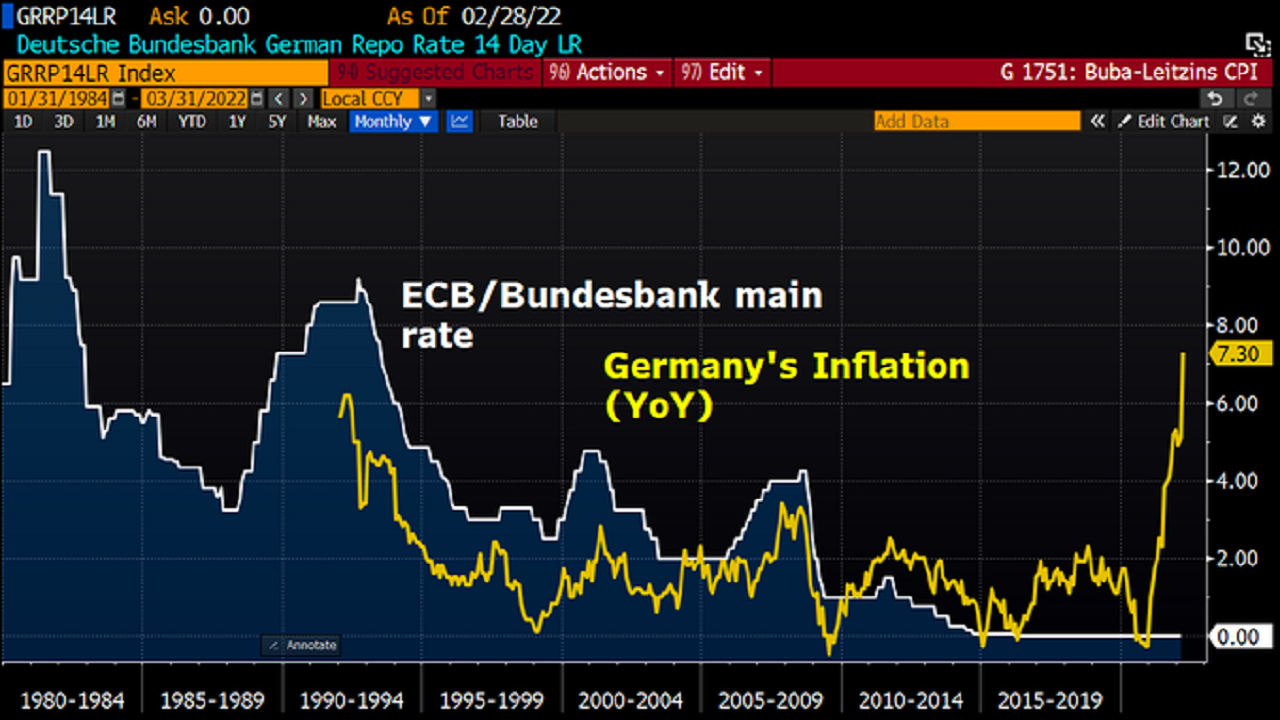
Source: Bloomberg
How far Central Banks can raise rates remains unknown and there is no way for us or even them to know in advance. It will be ‘trial and error’ and it is only by watching the market, economic and popular responses to the most recent changes that they will know when they went above and beyond the maximum point. We have to wait for something to break somewhere to indicate too much tightening.
In fact, as per a Bloomberg article on 8 April 2022, the ECB is already 'working on a crisis tool to deploy in the event of a blowout in the bond yields of weaker euro-zone economies, according to officials familiar with the plans'. It is 'designing a backstop that would be available for the Governing Council to use against debt-market stress caused by shocks outside the control of individual governments'.
I think that says it all!
Another factual data point comes from the Bank of Japan which started doing yield curve control to prevent the yield of the 10-year bond from going above its implicit target of ~0.25%. The BoJ showed its hand in Feb 2022 by putting an offer on the market to buy an unlimited amount of 10-year Japanese government bonds thereby putting a floor under the price of these bonds i.e. a cap on the 10-year yield at ~0.25% (price and yield have an inverted relationship). In other words, whatever inflation does and even if it goes up/stays high, the nominal 10-year yield will stay at ~0.25%.
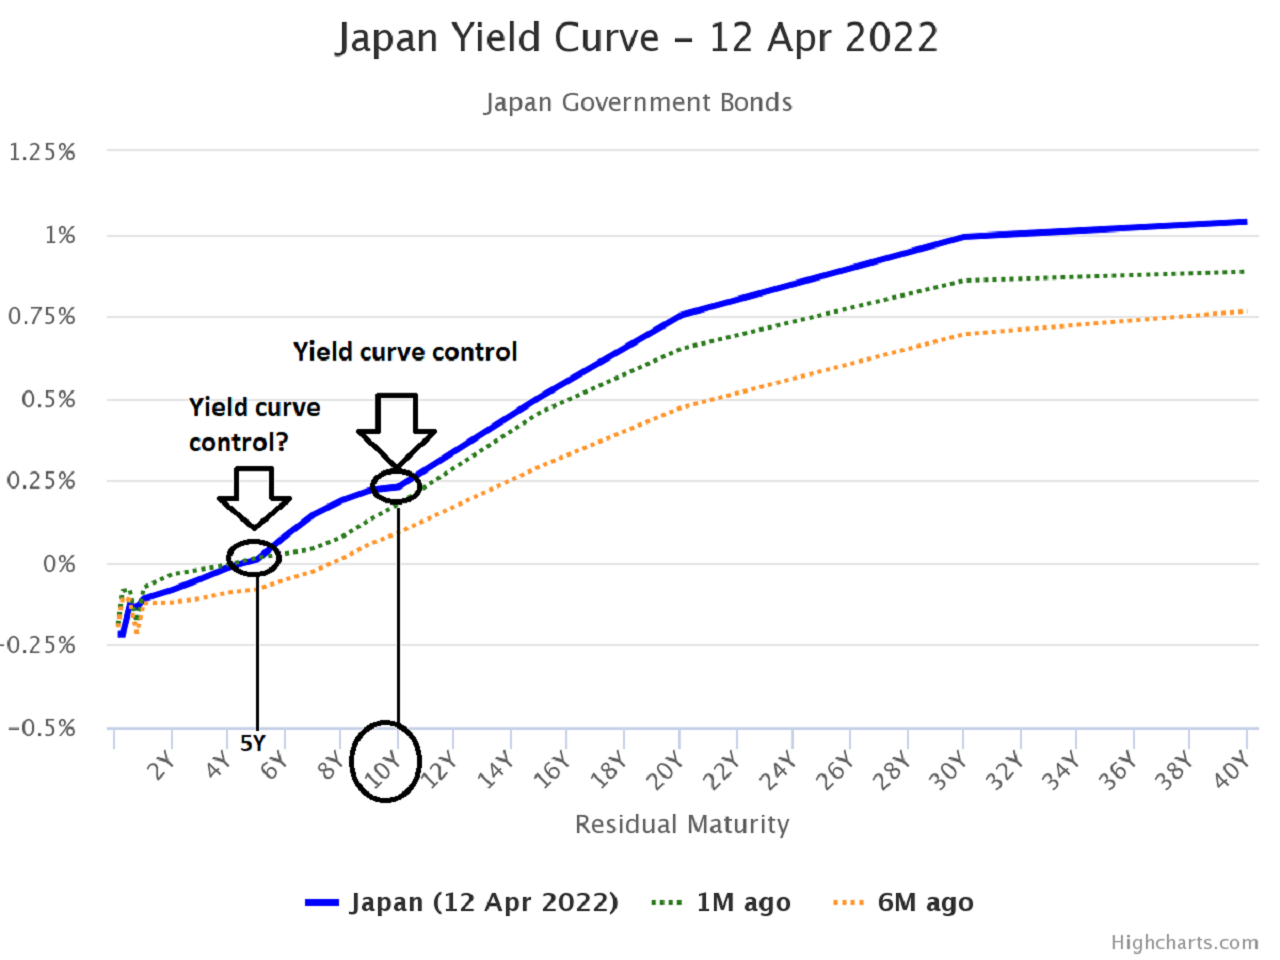
In my opinion, there is a significant chance of an accident happening. It will end up in a state of stagflation whereby economic growth has stalled or has become negative while inflation is still strong.
Wrap-up
We have seen that inflation will remain high for the years to come and that central banks will not be able to raise rates sufficiently to moderate it. This means that country bond yields will -on average in the next few years- remain below the inflation rate. This outcome is actually desirable for public finances as it will allow the quiet deleveraging of the massive amount of public debt built since the 1950s. Investors in government bonds will be made whole in nominal terms (so the US, France, the UK, Germany, etc will not 'officially' default). However, they will not be made whole in real terms as they will be paid back with EUR, $, Yen or £ that have lost purchasing value.
This context helps us define investment choices. In particular, our central scenario of stagflation or very low growth coupled with high inflation helps select assets likely to do well in the next few years.
- Cash is to be avoided as it is depreciating with high inflation. However one needs to keep several months worth to cope with adverse events. One can also keep some with a view towards investing in a better asset at an opportune time.
- Government bonds are to be avoided as they also lose out in real terms. Corporates bonds may have more attractive yields -possibly even above inflation- but those which do are certainly also very risky and in a context of low or negative growth the risk of default is too high in my opinion.
- Selected stocks might do well. These are companies that have pricing power (so they can raise prices in line with inflation and protect their profit margins) and which sell products or services that are not discretionary (so that even if consumers have to cut costs, they still have to purchase those items).
- Commodities need to be considered on a case-by-case basis. One needs to investigate likely future demand for a commodity along with supply issues (e.g. Russia, past under/over-investment, etc).
- Scarce assets should do well on the backdrop of continued monetary inflation. In particular, we will look at gold in the next article as well as bitcoin. As demonstrated by historical gold prices, an asset with limited supply tends to do well against fiat currencies inflated at will (see historical charts: USD vs Gold, British £ and Australian AUD vs Gold, Chinese Rmb and Japanese Yen vs Gold).
- Real estate should also do well in aggregate. In fact, we have shown in a prior article that while house prices consistently rise over time when priced in USD, GBP, or EUR, they are broadly flat when priced in gold—albeit with some volatility. This was demonstrated in the USA, the UK and France so it is likely to be the case worldwide. To really ensure investment success one certainly also needs to be selective e.g. with location, purchase price, etc.
Next steps
Keeping to our central economic thesis of upcoming years of low/negative growth coupled with high inflation, we will analyse gold and bitcoin as likely good investments. Both are scarce assets. Indeed, the amount of additional gold extracted from the Earth is about ~2% per annum and only a small fraction has industrial use. Bitcoin is programmatically limited to 21 million and hence is therefore often presented as 'digital gold'.
However, both assets are not the same and are likely to behave very differently in the short term. The next two posts will demonstrate the following central thesis:
- Gold should make new highs in the short term (few months) and will continue doing so in the long term (few years): $2,700/oz or above
- Bitcoin could first drop to $20,000 or below in the short term before reaching new highs in the long term.
To come to this conclusion, we will build on our macro-economic central scenario above. We will take into account the current market view of bitcoin as a 'risk-on' asset and mix it with technical analysis as a visualization of the emotional state of market participants.
