An alternative systematic investment approach using seasonality

March 20, 2021
The second part of this series looked at a strong historical seasonal pattern in equity markets where the ‘summer’ period is high risk and low returns. This is true for 113 markets out of 114 worldwide and it has been true for 300 years. In addition, ‘winter investing’ captures most or all of the yearly returns over the long run (e.g. 20 years) and exhibits lower drawdowns and reduced mid-term volatility.
In this post, we will look at a simple investing strategy ‘sell in May and go away’ or -more pragmatically- ‘winter investing with summer in cash’.
Key take-outs
- 'Winter investing' cuts off the tail returns, thereby limiting emotions that misguide the ‘average’ investor
- There are reasonable arguments to explain seasonality in equity markets. Hence, there is a fair chance of a causal phenomenon and not a spurious correlation.
- The astute investor can therefore consider investing only six months per year in ‘winter’ and spend a relaxing long ‘summer’ in cash while getting long-term returns relatively similar to being fully invested all the time.
A look at the distribution of returns
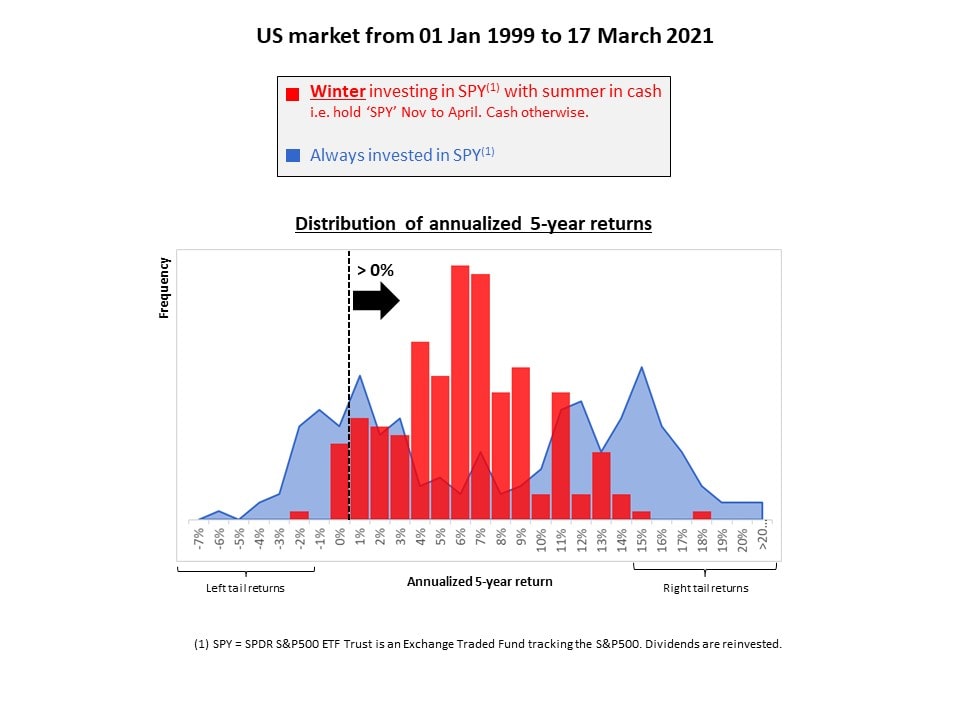
Using the US market as an example, the distribution of annualized 5-year returns has a different shape than the ‘always invested’ shape.
- The tail returns are effectively cut-off.
- There is 95% of a positive 5-year return vs. only 80% for being ‘always invested’ (calculation not explicitly shown on the chart for simplicity)
Cutting off the left and right tail returns i.e. the most extreme negative and positive returns by investing only 6 months per year is no small feat. These extreme returns trigger high emotions and push investors to make bad decisions either by fear of missing out or fear of losing money. Going back to part 1 of this article, these emotions play a major role in the poor long-term performance of the ‘average investor’. Therefore, cutting off most of these extreme returns also means protecting investors from themselves.
Conducting a sanity check
One might wonder about the causes of a seasonal pattern in the equity markets and if it is likely to continue. A quick online search reveals that there is debate as for whether this is a coincidence or if there are solid -yet argued about- reasons for it to continue in the future.
One such possible reason is the reduced trading activity and volume during the summer months in the Northern hemisphere. This is still the case despite the advent of electronic trading. Summer months represent the major holiday season in the year with reduced economic activity overall. Reduced trading volume and lower density in the order books create a market that is prone to increased volatility – particularly on the downside - thereby creating a context ripe for drawdowns. For clarity, it is worth noting that the Northern hemisphere is by far the largest chunk of the world equity markets.
Considering the strong ‘batting average’ (pattern true for 300 years and for 113 out of 114 stock markets worldwide) and the fact that we can find reasonable causal explanations, an investor might want to take a chance and exploit this phenomenon.
Leveraging seasonality
Based on my own simulations as presented in the second part of this series, an investor could choose to invest in a broad equity ETF (such as SPY for the US market) for only six months per year but only in the winter period. Simulations were run on the US, Japanese, European and German markets.
- He would have achieved a similar level of returns as staying invested all year long in the chosen ETF.
- More importantly, he would also have slept very soundly six months per year during the summer as he would be in cash.
In other words, this strategy has a different risk-return profile as the basic approach explained in part 1. One only invests six months per year with no market exposure in the summer. This assumes that the historical seasonality pattern will continue.
The exact timing of investment/disinvestment does not matter and results are not datamined
One might wonder if there is an exact date for investing / disinvesting. One might also wonder if the overall long-term pattern could be due to a statistical fluke such as a couple of high-impact historical events that happened just around the end or start of the summer or winter periods.
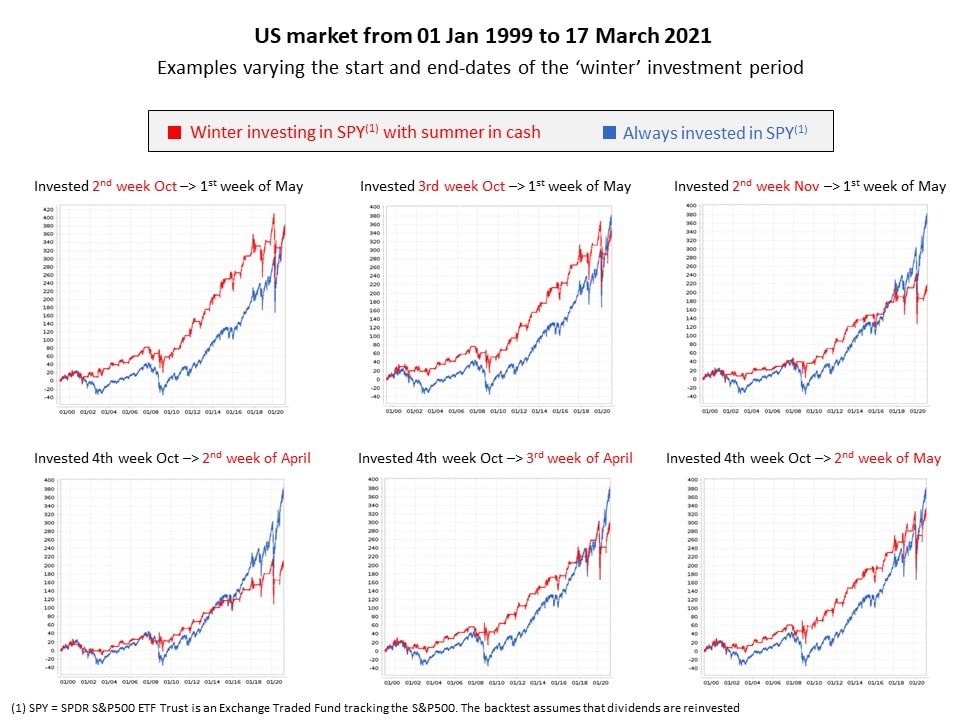
Once again, I ran a number of simulations on the US market and tested entering and exiting the market +/- 2 weeks the dates of 01 November and 01 May.
The results in the charts below are very clear. Over the long-term (i.e. 20 years), the exact timing does not matter. Entering the market sometime around early November and exiting sometime around early May works well.
Click here for a larger image (pop-up window)

Wrap-up
We have seen that the average investor obtains poor investment returns. A systematic investment process is one way to control the fears and emotions that lead to this disappointing outcome.
The systematic approach ‘sell in May and go away’ builds on a strong historical seasonal pattern in equity markets: summers are high risk and low returns. This pattern is robust across geographies (113 out of 114 countries) and across time (3 centuries). It is therefore worth considering.
It enables an approach whereby no investment risk is taken from May to October (‘stay in cash’) while the investment risk is only taken from November to April (‘buy and hold a broad market ETF such as SPY’). One- to two-decade-long simulations conducted on portfolio123.com with the US, European and Japanese markets show that the overall returns are of the same order of magnitude as the returns obtained by staying invested all year long. However, this level of return is obtained while sleeping well and fully enjoying every single summer over this period.
Part 4 of this series introduces an additional investment strategy option. It also builds on the seasonal pattern but adds a new layer based on a selection of investment vehicles.

