April 2021: Is it time to invest in gold?

18 April 2021
Learnings from thousands of years of fiscal and monetary history
Ray Dalio articulated and popularized the concept of short-term and long-term debt cycles (see the video 'how the economic machine works'). In the case of long-term debt cycles, policymakers face the task of deleveraging enormous levels of debt, i.e. debts of a few hundred per cent of GDP. The debt levels are so high that it is almost impossible to deleverage nominally since this would mean accepting tidal waves of corporate defaults, job losses, price declines, along dramatic reductions of state and local tax revenues while facing increasing demands for welfare benefits.
Going back to ancient Greece and Mesopotamia, the policymakers' typical answer is to reduce the level of debt relative to the units of currency by creating more currency units out of thin air, i.e. by 'printing money'. This also devalues the currency relative to a widely accepted scarce store of value such as gold. Indeed, when printing money, there are suddenly more units of the currency chasing an unchanged amount of gold: one cannot suddenly extract gold out of the crust of the Earth (the amount of gold above the Earth surface increases by about 2% per annum). The outcome is that gold price goes up over decades or centuries when priced in the currency units.
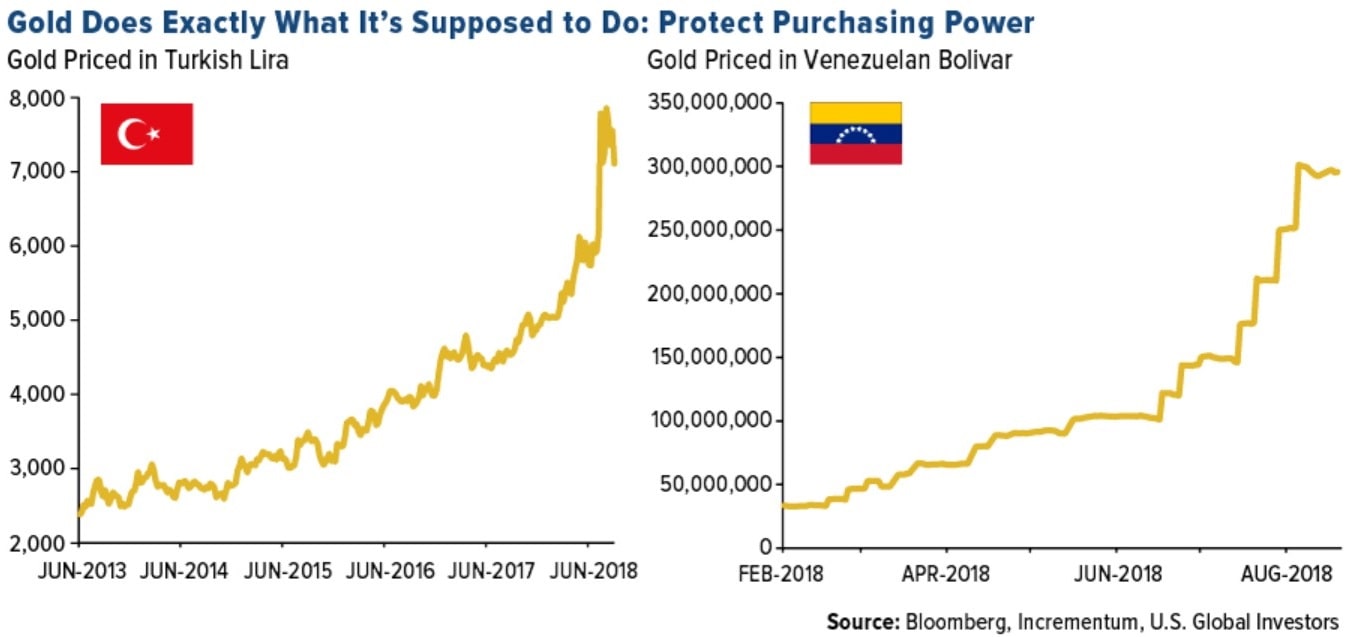
Besides, and even within a long-term debt cycle, wars, populism, mismanagement, corruption, or competitiveness with other countries (i.e. aggressively reducing the currency value relative to other currencies to make products cheaper when priced in the buyers' currencies e.g. China) can drive down the value of the currency relative to gold. The charts below show two extreme examples of the exponential growth of the price of gold in a matter of years or even months when priced in Turkish Lira or Venezuelan Bolivar.
Click here for a larger image (pop-up window)
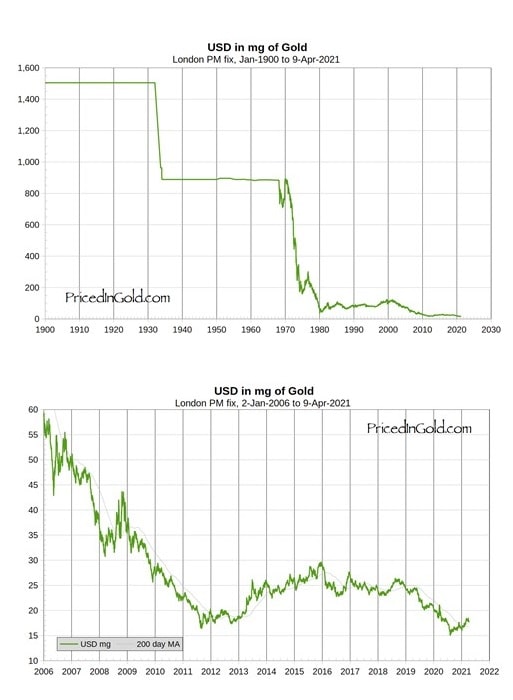
Without going to such extremes and sticking with major currencies such as the US Dollar, the British £, the Australian $, the Japanese Yen, or the Chinese Renminbi, the result is clear for anyone to see in the charts below. These charts are the inverse of what we normally see plotted, i.e. they plot how much milligram (mg) of gold is required to get one unit of the currency. We can see that it takes less and less gold to buy one unit of the currency, and this is true for the US Dollar, the British £, the Australian $, the Japanese Yen, or the Chinese Renminbi. It is also true for the Euro (chart not provided here).
One US Dollar priced in mg of gold from 1900 and a close-up from 2006:
Click here for a larger image (pop-up window)
One British £ and one Australian Dollar priced in mg of gold (respectively from 1980 and from 1990):
Click here for a larger image (pop-up window)

One Chinese Renminbi (from 1990 and a close-up from 2005) and
one Japanese Yen (from 1998 and a close-up from 2006) priced in mg of gold:
Click here for a larger image (pop-up window)
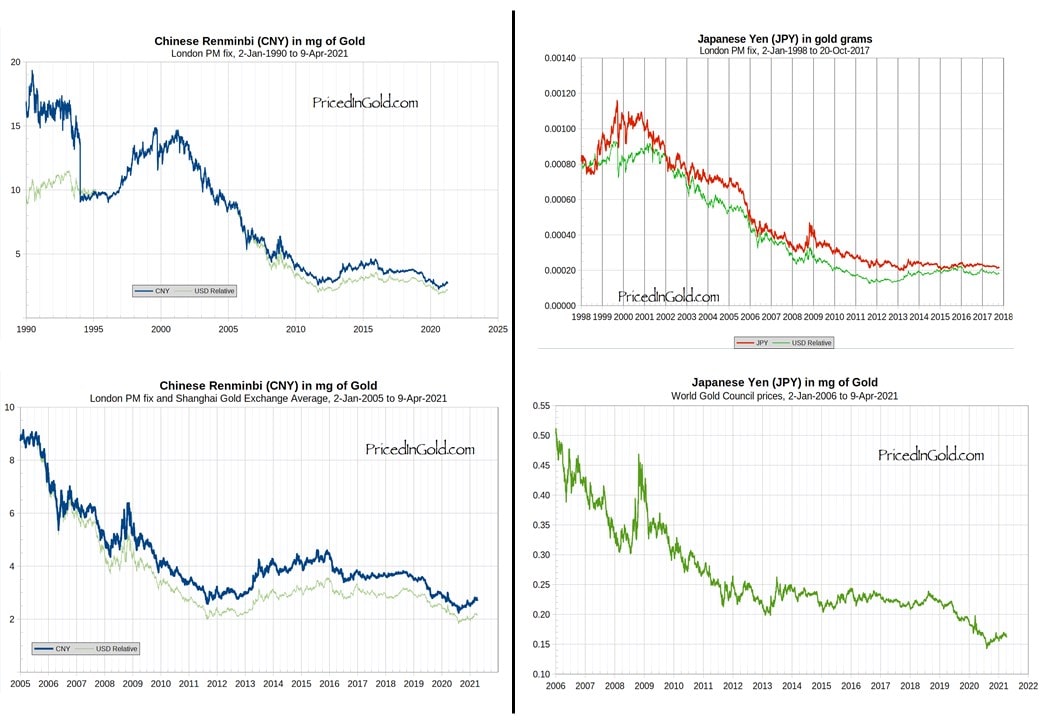
It should now be clear to the patient investor that holding gold for several decades is a quasi-guarantee to do well. However, the attentive reader would have noted that there can be fairly long periods when gold temporarily depreciates against a given currency. Two examples in the charts above are the twenty-year period from 1980 to 2000 against the US Dollar or the British Pound. For a typical working adult, twenty years is about the period of time when one can invest the most, i.e. from his/her late thirties to his/her late fifties.
It is therefore clear that while one should have a bias in favour of being 'long' gold, one needs to be more granular when it comes to the timing of his/her investment and look for a period where gold is likely to do well against a basket of mainstream currencies. Note: being 'long' an asset is trading parlance meaning owning/having invested in this asset with the expectation that its price will go up.
The current macroeconomic situation
It turns out that we happen to be in a period where cumulated individual, corporate, and state debts have reached very high levels in many countries across the world. The covid pandemic further accentuated the issue by reducing GDP (i.e. by shutting down businesses during lockdowns) and raising the level of all types of debt (individual, corporate, national) relative to GDP.
As a result and in line with historical practices, monetary inflation ('money printing') has reached unprecedented levels. We use the USA as an example, but the story is the same for other major economic zones and currencies (readers choosing to take China's optimistic official figures at face value will do so at their own risk).
The chart below shows the US 'M2 money supply'. M2 is defined as cash, checking deposits, savings deposits, money market securities, mutual funds, and other time deposits (such as certificate of deposit). In short, M2 represents money (e.g. cash) or near-money quickly convertible to cash (e.g. savings) circulating in the economy at a given point in time.
The blue line represents the M2 amount in US$ billions from 1959 to Feb 2021, while the red line is the year-on-year per cent increase. One can see the long-term near-exponential increase in M2 money supply (blue line) along with the spectacular jump in 2020 (red line).
Click here for a larger image (pop-up window)
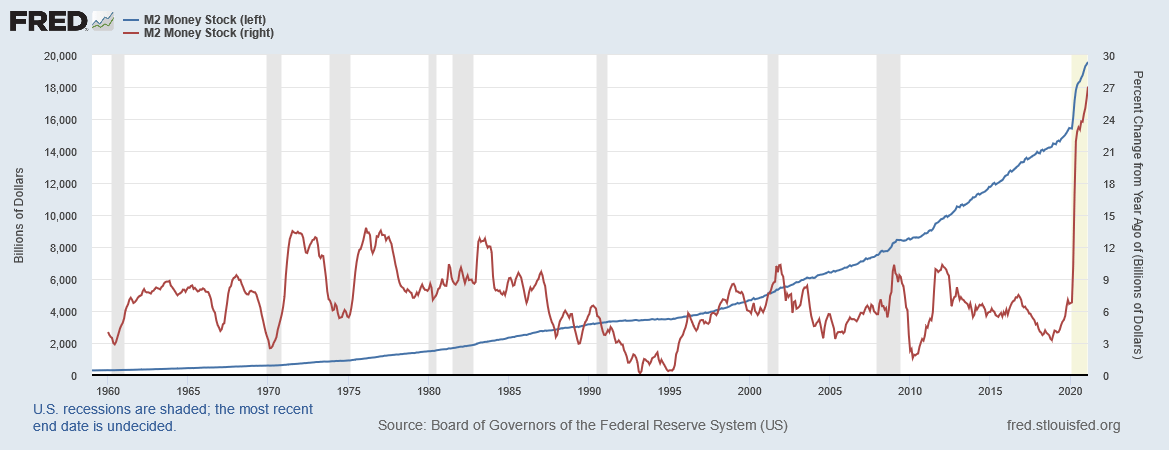
This environment is therefore very favourable for gold. The amount of gold typically increases by about 2% per annum in the long run, whereas we got a sudden ~25% increase in the M2 money supply in the USA. As a result, the price of gold jumped from about US$1,600 in Feb 2020 to about US$2,100 in August 2020.
The environment remains favourable with further fiscal and monetary expansion already approved or planned across the world. However, since its August 2020 top, gold has pulled back by about 20%, down to circa US$1,675.
The connection to bond yields
This pullback can be linked to the rise in real long-term bond yields (e.g. the US 10-year treasury note). The real yield is defined as the nominal yield minus the expected Consumer Price inflation rate. When real yields are high, gold is less attractive as it does not 'produce any yield'. It is scarce and will broadly keep its value or increase it over a long period of time, but it does not pay regular coupons as a bond does. As such, rational investors will choose to own bonds rather than gold if the real yields are high enough, thereby placing downward pressure on the gold price. One can see on the chart below the strong inverse correlation between gold price (in red) and 10-year real yields (in blue).
Click here for a larger image (pop-up window)
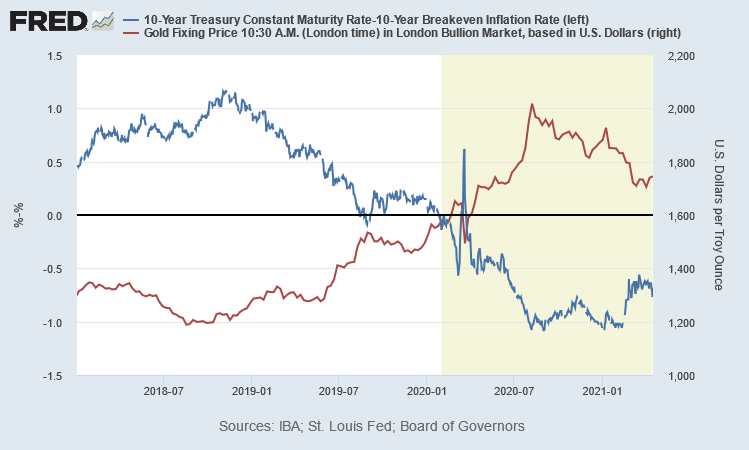
As defined above, the real yields are the difference between the nominal yields and the expected Consumer Price Index inflation rate. When left entirely to free-market forces (i.e. investor supply & demand), nominal yields will tend to rise along with inflation expectations and/or expectations of economic recovery likely to trigger interest rate rises.
The chart below shows the US yield curve, i.e. the spectrum of nominal yields for all maturities of US bonds as of 18 April 2021, along with what it was one month ago (red) and six months ago (green). For example, the 10-year nominal yield is currently around 1.6%, whereas it was about 0.75% six months ago. The 2-year yield is about 0.16% both now and six months ago.
Click here for a larger image (pop-up window)
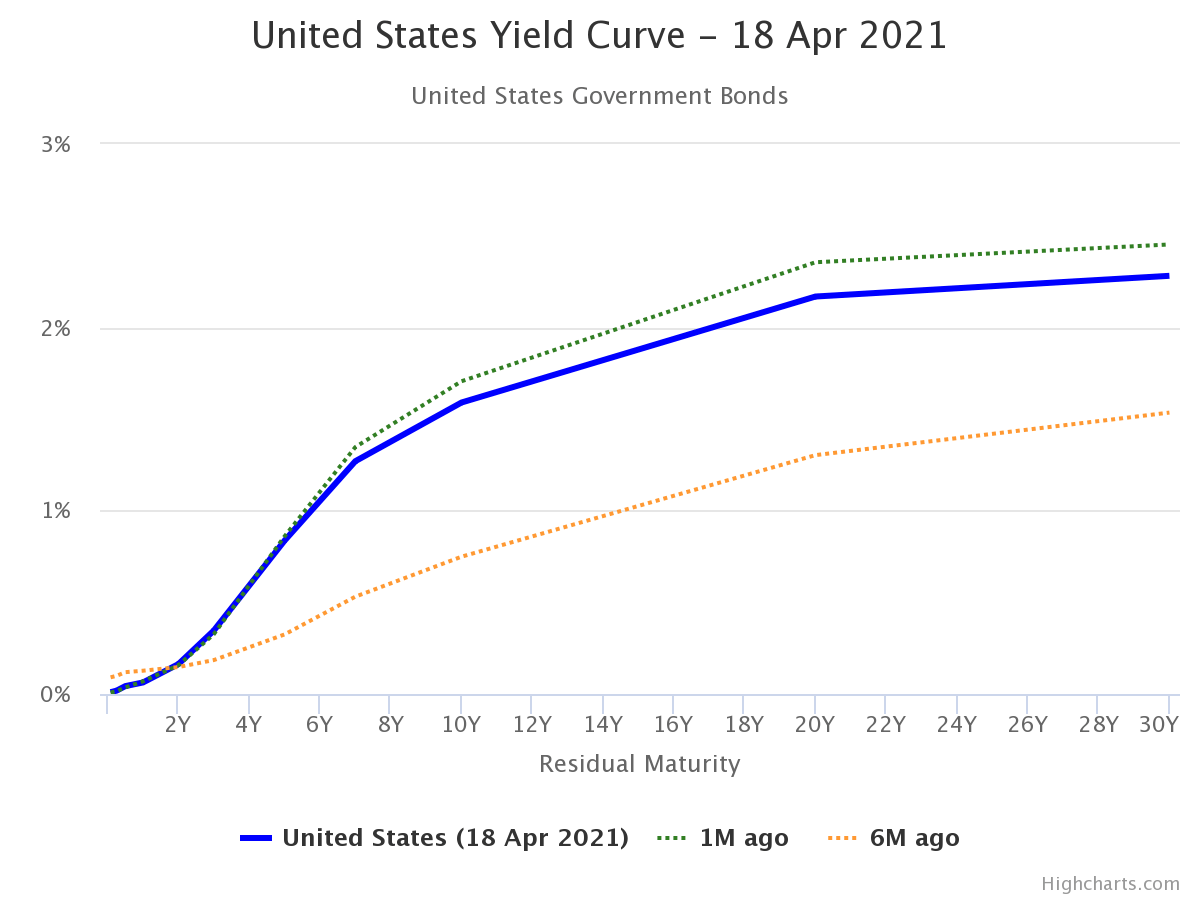
One can see a significant increase in yield over the last six months for all maturities longer than two years. But there is one major problem: this means that the cost of servicing all long-term US$ denominated debt has largely increased in US$ terms over the last six months.
In plain English, it means that mid- to long-term debts have higher regular interest payments than six months ago. This is true for corporate debt and US federal, state, or municipal debt alike. With all these entities having an enormous amount of debt, the cost of regularly servicing this debt cannot rise too high. Otherwise, most corporate, national, state or other budgets will be 'eaten up' by debt repayments with little left to actually do something productive (e.g. building a factory in the case of corporations or improving healthcare or education for state or national budgets). Rising nominal yields is, therefore, not a situation that is likely to be left to free-market forces.
Central banks (the US Federal reserve or others) can actually 'lock' the nominal yields to an artificially low level. To do this, a central bank buys the bonds issued by their government with new money that the central bank just printed out of thin air. By contrast, in a normal situation, the bonds are bought by real lenders, local or foreign, with existing money (examples of real bond buyers are individuals, corporates, asset managers, pension funds, life insurers).
By stepping in and substituting itself to normal bond buyers, the central bank effectively puts a floor to the bond prices, which puts a cap on the bond yields (bond prices and bond yields are inversely related). By buying at carefully calculated prices, a central bank will set the desired level of yields. It is called 'yield curve control' and was last done after the Second World war in the USA.
In other words, under pressure from policymakers, the nominal US 10-year yield could be brought back down to a much lower level. If inflation expectations remain the same, this means that the real yield will drop (since real yield = nominal yield minus inflation expectations), which will, in turn, make gold more appealing to investors, thereby bidding up again the price of gold.
Another way to look at this is to realize that, since the central bank buys government bonds with newly created money, more money is suddenly generated out of thin air but still chasing the same unchanged amount of gold. Mechanically, the price of gold will go up.
The question is whether this could be happening soon. Looking globally, Australia has already locked its 3-year yield, and the ECB seemed to have announced in a confusing video conference a few weeks ago that they will do so using 'any means necessary'. In the end, for any nation or currency zone, it comes down to the level of regular interest payments on the debt that is bearable, i.e. the level that leaves enough room in the budget for other expenditures such as social protection, healthcare, housing, education, defence, etc.
For example, the chart below shows the UK public sector spending for 2021-2022 with a debt interest of £45 billion. Should this debt interest double and rise to, say, £90 billion, £45 billion will need to be taken from somewhere else in the budget, or taxes will need to be increased, or a combination of both.
Click here for a larger image (pop-up window)
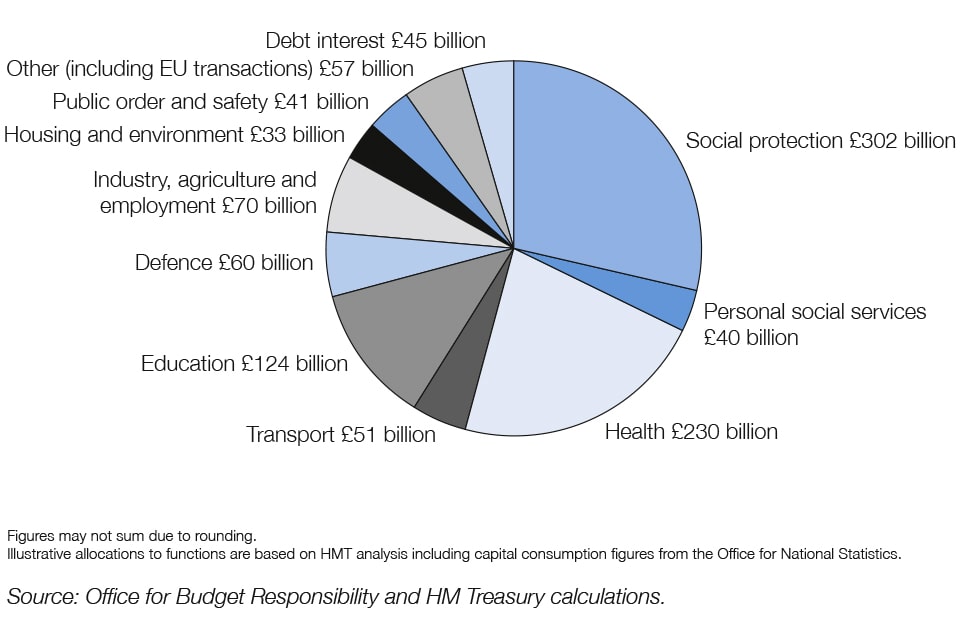
In summary, if bond yields are left to rise freely, local governments will be faced with the perspective of raising taxes and cutting public services. This is hardly a recipe for a successful reelection campaign. It is much simpler to 'ask' the local central bank to force local currency-denominated bond yields to low levels.
Since something needs to give, this means the local currency will depreciate, which is positive for the price of scarce stores of value such as gold. We are starting to see or being told about such actions (Australia Central Bank, European Central Bank), and the market might have just turned and concluded that such actions will generalize across the world. The US 10-year treasury real yield in the chart above seems to hint at this conclusion: it topped at about -0.6% in recent months and now seems to head back down in even more negative territory.
Gold just made a 'W bottom' chart pattern.
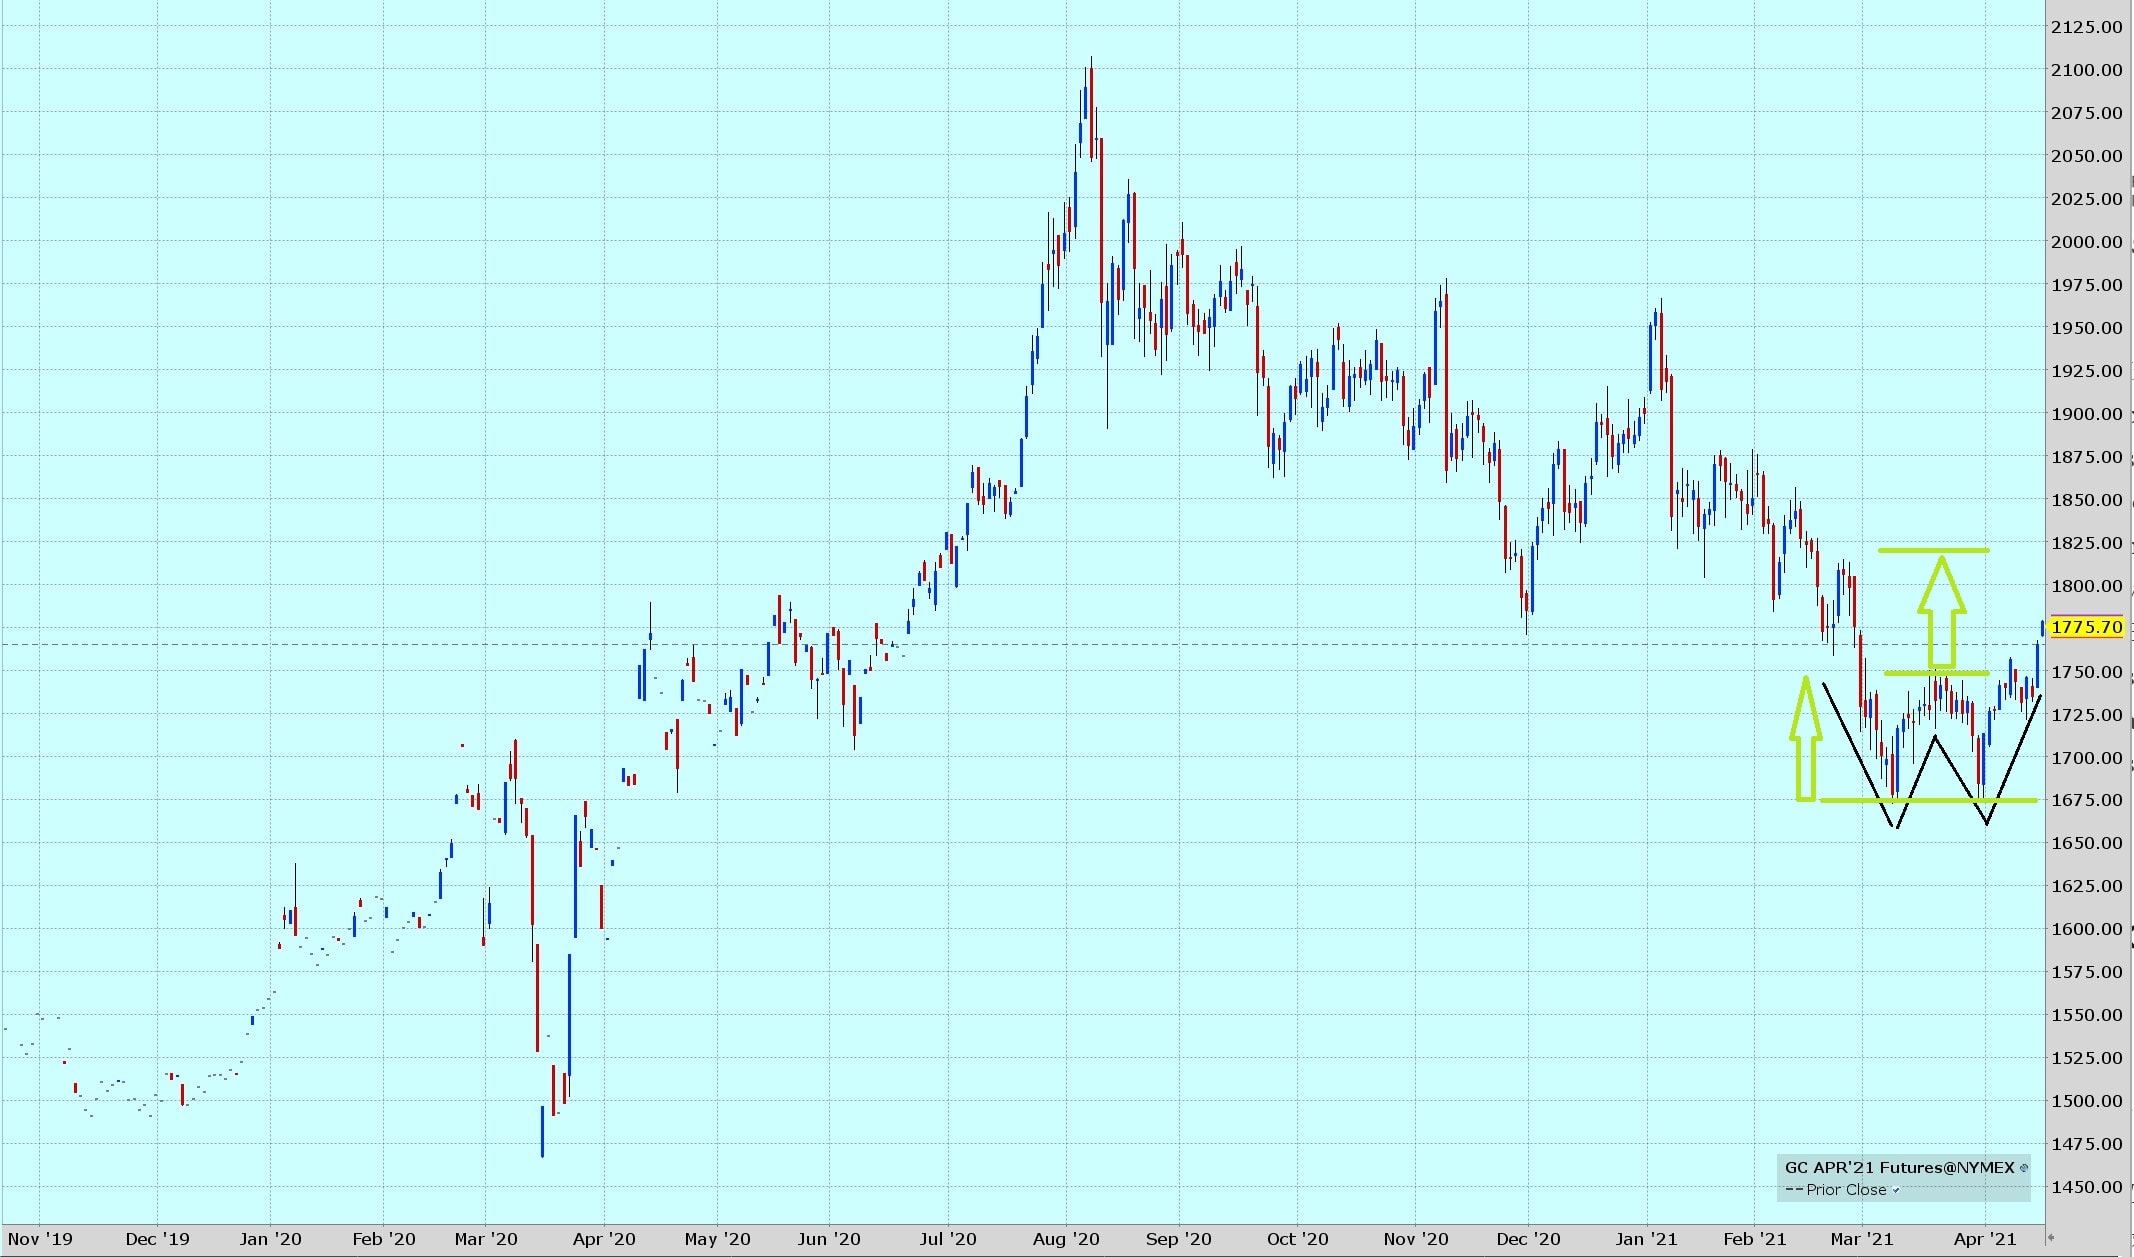
Fans of technical analysis would have noticed a recent superb 'W bottom' on the daily gold chart. It is highlighted in the April gold Futures chart below in black. The theoretical target of such a pattern would price gold at about US$1820 (green arrows).
Therefore, the price action seems favourable to the narrative of gold having bottomed and completed an 8-month long pullback.
Click here for a larger image (pop-up window)
Wrap-up
Going back thousands of years, history has taught us that fiat currencies (e.g. US$, EUR, GBP, AU$, etc.) lose value against gold over long periods of time. Gold is a scarce asset whose available quantity only increases slowly at about 2% per annum. Besides, the current macroeconomic environment is favourable to gold with extreme levels of monetary inflation ('money printing').
Furthermore, bond yields might have just risen to levels high enough that they will force policymakers to act to limit the cost of servicing their mountains of debt. Such action could mean pegging the long-term yields to artificially low levels, thereby driving up the price of gold.
Finally, we note that the gold price action just completed a 'W bottom'. All this put together could mean that gold has completed its pullback and might be on the rise again - possibly for several years. Readers should, of course, do their own research and make their own judgment.
