The theoretical foundations of Financial Markets are in dispute

13 July 2017
If you have recently seen a Financial Adviser, you might have a warm and confident feeling that your money is in good hands. Your adviser might have explained to you that he/she has built your portfolio to be on an optimum called ‘efficient frontier’. It supposedly offers the maximum possible expected return for a given level of risk. You might even be able to visualize this on the website of your bank or on a fancy-looking app on your cell phone. Yet, you should be wary of appearances or reassuring words...
As Finance or Business School graduates would remember, this reassuring view is entirely based on a model called ‘Modern Portfolio Theory’. It is a hypothesis put forth by Harry Markowitz in a paper published in 1952 but it has very serious limitations. To understand these limitations and therefore to know what to really expect, it is vitally important to understand what the assumptions underpinning this theory are.
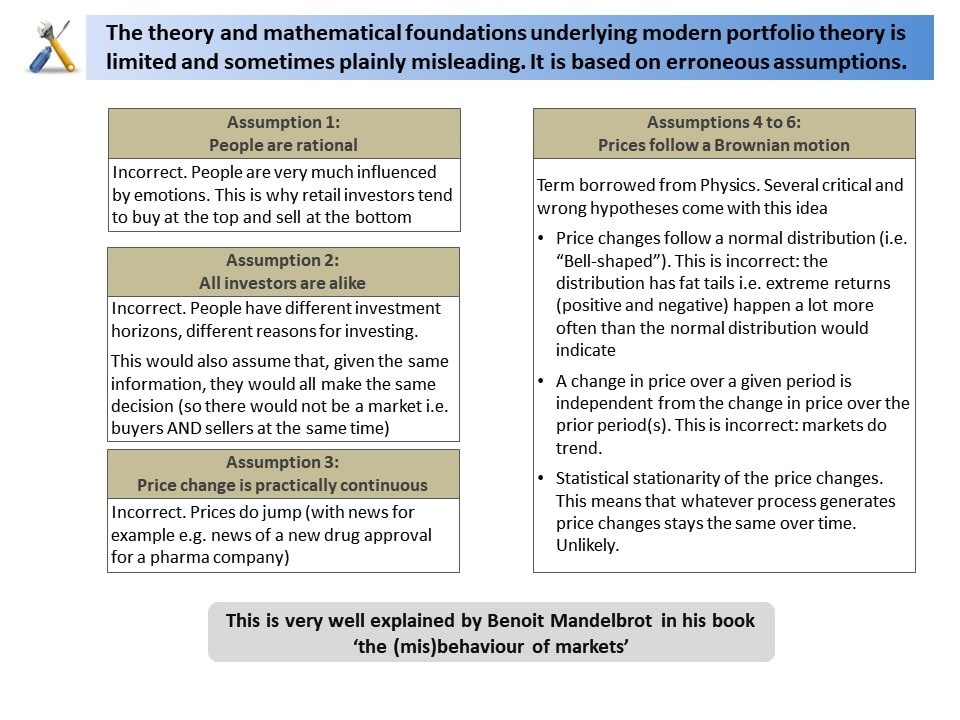
There are 6 underlying assumptions of major significance:
- People are rational.
- All investors are alike.
- Price change is practically continuous.
- Price changes follow a normal distribution (i.e. ‘Bell-shaped’).
- A change in price over a given period is totally independent from the change in price over the prior period(s).
- Whatever statistical process generates price changes does not itself change over time.
Let us examine a few of these assumptions to determine how confident we can be in the whole theory:
1) The first assumption alone (‘People are rational’) should immediately raise a red flag.
- People are very much influenced by emotions when making decisions.
- In the case of retail investors, this is demonstrated by the fact that they tend to “buy at the top and sell at the bottom”.
2) The second assumption (‘all investors are alike’) is also easy to prove wrong.
- Market participants both retail investors or professional players have different investment time horizons and different reasons for investing. For example, a High Frequency Trading (HFT) firm might place hundreds of trades per second, whereas the asset management arm of a life insurer will tend to hold its positions for months or years to align its approach to long term commitments (e.g. annuity payments).
- Presented another way, if all investors were alike and given the same information, they would all make the same decision (particularly if we factor in the assumption ‘all investors are rational’). This would mean that every single market participant would get to the same conclusion regarding an asset (i.e. everyone would want to buy or everyone would want to sell). This obviously implies that there could not be a market since everyone would either be seller or buyer but there would not be buyers and sellers at the same time. Yet markets do exist and people very much disagree on whether to buy or sell (think of the Tesla stock for example).
3) As for the third assumption (‘price change is practically continuous’), it is contradicted by the fact that prices do jump fairly often.
For example, they jump on the news of a new drug approval for a pharmaceutical company, on an unexpected central bank announcement or following electoral results.
4) The most fascinating and possibly most deceiving of all these assumptions is the fourth one: ‘Price changes follow a normal distribution’.
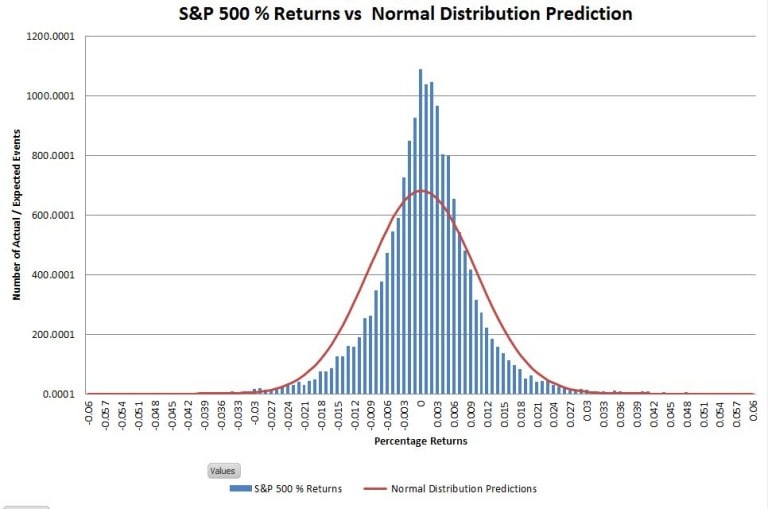
- ‘Graphic A’ below compares the distribution of daily percentage returns of the S&P500 from 1950 till June 2016 (in blue) with the matched normal distribution (in red). The real returns have a higher central peak and ‘narrower’ shoulders than the normal distribution but the fit is not so bad when using a vertical linear scale.
Click here for a larger image (pop-up window)

Graphic A (credit: Vance Harwood; https://sixfigureinvesting.com)
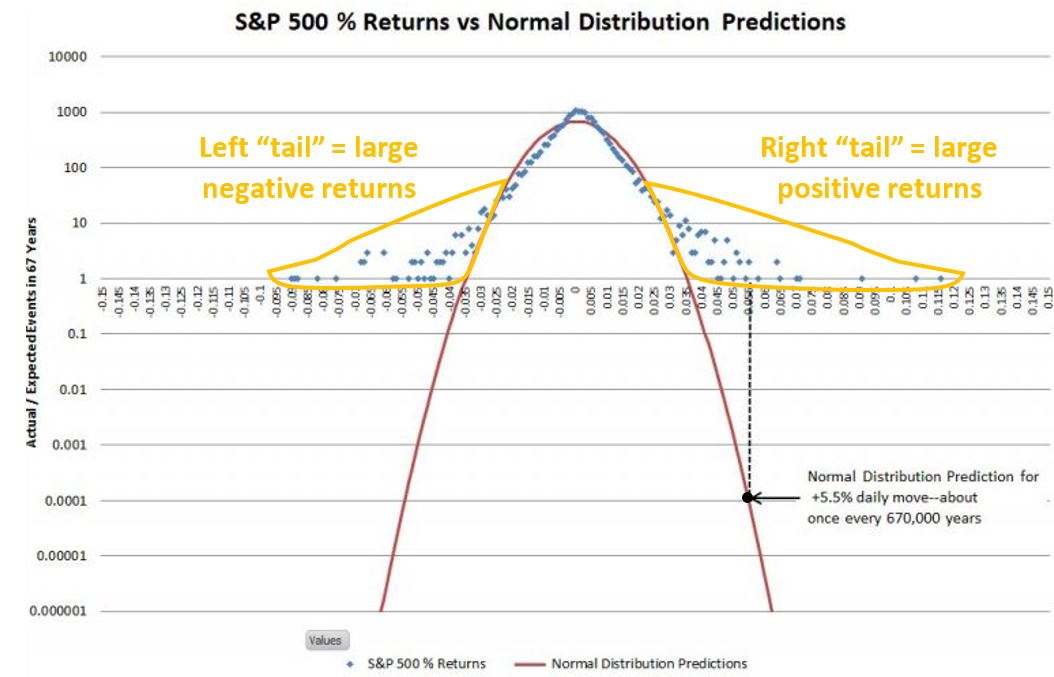
- However, the key difference and huge mismatch is in the tails of the distribution which are not really visible on a linear scale. ‘Graphic B’ is the same plot as ‘Graphic A’ but uses a vertical logarithmic scale instead of a linear one. It therefore allows to show what is happening in the tails of the distributions.
Click here for a larger image (pop-up window)

Graphic B (credit: Vance Harwood; https://sixfigureinvesting.com)
- Using that scale, one can observe that the normal distribution hugely underestimates the probability of extreme events. For example, a return in the +5.5% to +5.6% range in one single day should theoretically happen 0.0001 time in 67 years i.e. only once every 670,000 years. Yet in reality, it has already occurred twice in the period 1950 to June 2016 i.e. twice in 67 years!
- While volatile days might appear rare enough, one needs to remember that these are returns both higher than +3.5% or inferior to -3.5%. In particular, large negative returns will be the ones surprising everyone and driving investors out as they are theoretically not supposed to happen over a human lifetime. Investors will typically exit at the worst possible time i.e. at market bottom when they should actually be piling in.
- A future article will show the pitiful returns achieved by retail investors over long periods of time when compared to the S&P500. This is because of the emotions that drive them but also because they might have not been told how misleading the theory underpinning their portfolio allocation was. It is indeed harder to believe the reassuring words of an asset manager or financial adviser when one’s portfolio has dropped 6% the prior day while this is only supposed to happen once in a million years! (One can observe from 'Graphic B' that there were almost a dozen single days where the SP500 dropped 6% or more in the period 1950 to June 2016)
In summary, although 'Modern Portfolio Theory' remains the model most taught and used, it can be extremely misleading. It could lure investors and professionals alike into a false sense of security.
Simply put, extreme returns (both positive and negative) do happen a lot more than expected.
Benoit Mandelbrot in his book ‘The (mis)behaviour of markets’ deserves all the credit for pointing out and articulating these unspoken yet dramatically important assumptions. This is an excellent and easy read to better grasp market behaviours and therefore make better investment decisions.
Click here for a larger image (pop-up window)

