The seasonality of equity markets

20 March 2021
The first part of this series was published on 18 March 2021. It showed the poor long-term investing track-record of the ‘average’ investor. It also described an extremely simple systematic investment strategy for the equity markets: buy a low-cost index fund and remember to reinvest the dividends as and when they are paid - as opposed to leaving them in cash.
In this post, we will set the scene for another simple -but a bit more active- investing strategy ‘sell in May and go away’ or -more pragmatically- ‘winter investing with summer in cash’.
Key take-outs:
- There is a strong seasonal pattern in equity markets: the ‘summer’ period is high risk and low returns.
- ‘Winter’ investing captures most or all of the yearly returns over the long run (e.g. 20 years) and exhibits lower drawdowns and more appealing statistics.
A strong historical seasonal pattern in equity markets
The strategy ‘winter investing with summer in cash’ builds on an interesting long-term historical statistical observation: equity markets exhibit a marked tendency to be high risk and low returns in the summer months in the Northern hemisphere.
In other words, if one is to be invested in equities only six months per year and be in cash the other six months, one is much better off investing during the 6-month ‘winter’ period rather than the six-month ‘summer’ period. Hence this approach has sometimes been labelled as ‘sell in May and go away’ or ‘the Halloween indicator’.
A few academic researchers have investigated this statistical anomaly on 114 stock markets worldwide. It is true for all markets except for Mauritius. It has also been true for more than 300 years when using the UK stock market which opened in 1693.
Sources:
- The Halloween Indicator, 'Sell in May and Go Away': Everywhere and All the Time. (SSRN #2154873)
- Are Monthly Seasonals Real? A Three Century Perspective (SSRN #1697861)
Confirming the seasonal pattern on the US, European, and Japanese markets
Using the simulation platform www.portfolio123.com, I personally investigated the US stock market since 01 Jan 1999 and a few major international markets since the late 2000’s. Starting dates were limited by the availability of earlier data on the portfolio123 platform or the availability of US-based currency-hedged ETFs for Europe and Japan.
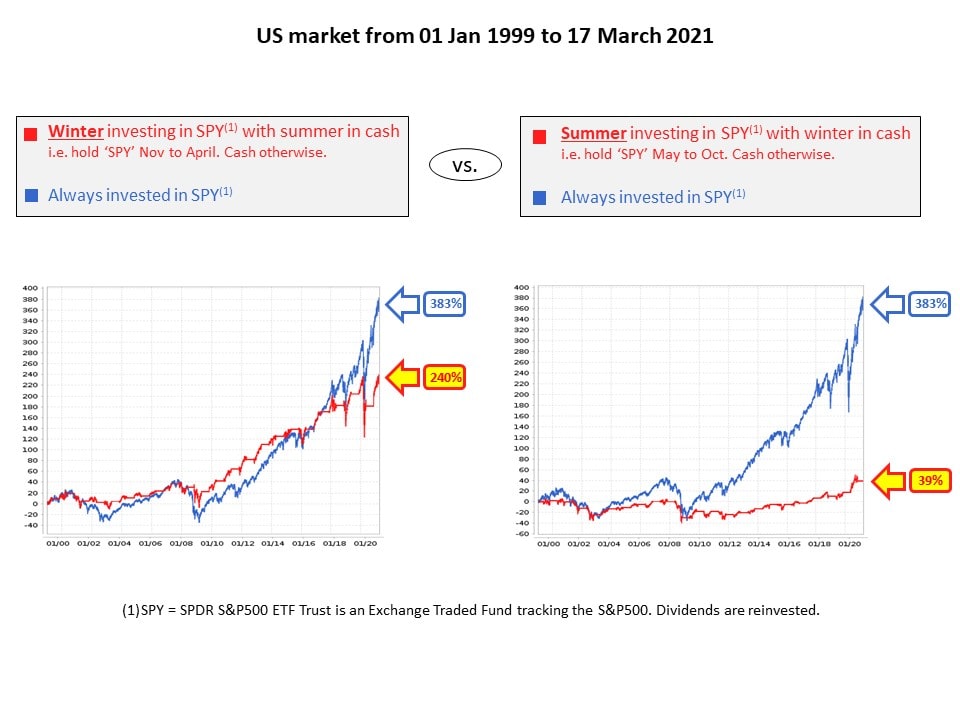
The results of ‘winter investing with summer in cash’ are very clear and shown in the charts below:
- The return of this approach is way superior to the opposite strategy (the opposite strategy is ‘summer investing with winter in Cash’).
- The ‘winter investing’ strategy captures most or all of the ‘stay invested all year long’ returns while investing only six months per year.
Click here for a larger image (pop-up window)
Click here for a larger image (pop-up window)

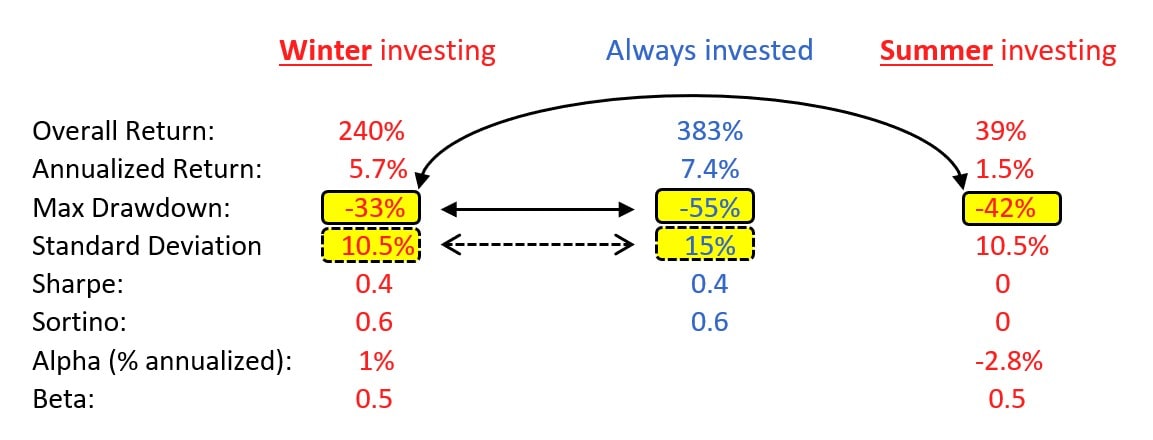
In addition, and using the US market as an example, ‘winter investing’ has a better risk profile than both the ‘summer investing’ and the ‘always invested’ approaches. One can look at the statistics in the tables below, e.g. the standard deviations (lower is better) or the maximum drawdowns (higher i.e. less negative is better). The maximum drawdown is defined as the worst ‘drop’ from a top to the subsequent bottom and is particularly difficult to handle emotionally.
Click here for a larger image (pop-up window)
Wrap-up
Part three of this series will look at the distribution of returns to show that 'winter investing' effectively cuts off the tail returns. It will also consider whether this seasonality has reasonable grounds to exist and continue as opposed to simply being a spurious correlation. It will then articulate what this could mean for the astute investor.