$4,000 is an attractive entry-point for Ethereum when combining macro backdrop and technical analysis

20 oct 2021
Ethereum (ETH) -the second-largest crypto-, displays an interesting technical setup on the backbone of a supportive macro trend. This could be a good entry point for short-term (few weeks) to mid-term (few months) gains, first of ~30%, then of 60% to 70%. Assuming the macro-environment stays supportive, the longer-term trend points to +300% to +550% by the first or second quarter of 2022 (with strong volatility along the way).
The macro background is supportive of crypto-assets and of ETH.
The general macroeconomic environment is favourable to the crypto-asset world. There is considerable monetary inflation worldwide (money-printing) coupled with negative real long-term bond yields. The macroeconomic sections of these bitcoin and gold articles articulate this point in more detail. This means that there is significant investable money seeking assets that have a chance to bring positive real returns (as opposed to 'guaranteed' negative real returns for bonds in most developed countries).
In the case of ETH, the current narrative and background are also supportive. The DeFi ecosystem is growing, requiring a higher use of the token; the London EIP 1559 upgrade made the asset less inflationary and even deflationary here and then; finally, the much-delayed passage from Proof of Work to Proof of Stake could be a few months away (H1 2022?) and make ETH more scalable, thereby making its use more widespread.
Technical analysis of ETH price action shows that the current $4,000 price could be a very interesting entry point.
The chart below plotted on a log scale shows a long-term 'tunnel' which would point to a target in the ~$18,000 to $22,000 in H1 2022. As of this writing, ETH is around $4000.
The price action also printed an inverted 'head and shoulder' pattern with a short-term target of circa $5,300 (+30%). Stepping back a little, there is another classic 'cup and handle' pattern pointing to a price target of $6,300 to $7,000 (+60% to +70%).
Click here for a larger image (pop-up window)

Click here for a larger image (pop-up window)

Should these patterns fail, it will quickly be obvious. Hence the interesting nature of the current price as an entry point allowing for good risk control. With such a volatile asset, risk control is key and the difference between bankruptcy and wealth.
In our case, a daily close below the right shoulder i.e. circa below $3,300 would invalidate the inverted 'Head and Shoulder' pattern. A daily close below the bottom line of the diagonal tunnel would invalidate the whole approach. Depending on the day, this level varies as the line is diagonal: it could be $3,200 (fourth week of October 2021) or $3,500 (second week of November 2021). I would personally favour seeing two daily closes below the chosen level to make sure the first one is not 'Mr Market having a laugh at your expense'.
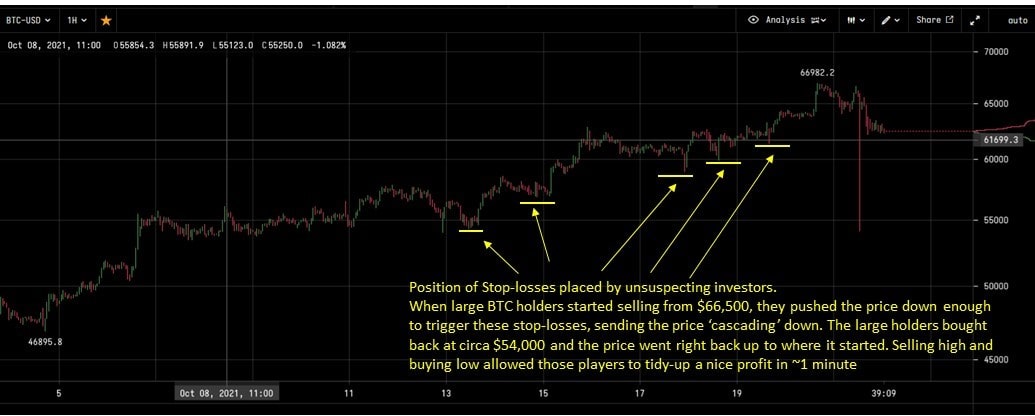
The emphasis above is on daily close as opposed to a price point at any time in the day. Crypto markets are extremely volatile and have relatively limited liquidity on each of the exchanges. This allows large crypto holders to go and chase stop-losses placed by unsuspecting investors. To do this, they can sell large amounts of cryptos, pushing the price down till it hits the stop-losses placed by other investors. When triggered, these stop-losses become market orders ('sell at any price'), further cascading the price down. The large players can then buy back at a much lower price, drive the price back up close to where it started and pocket the difference.
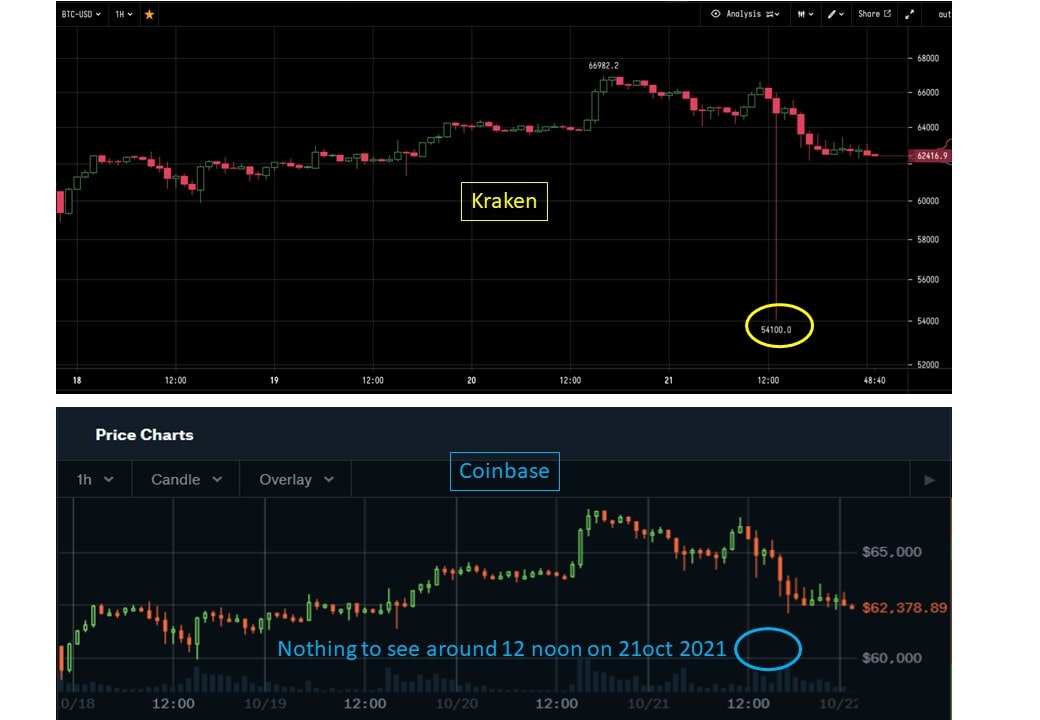
Below is an example of BTC-USD on 21 Oct 2021 around noon European time. BTC on Kraken printed a low of $54,100 not visible on Coinbase.
Click here for a larger image (pop-up window)

This was likely caused by one or more large players on the Kraken exchange. But they were not playing on the Coinbase exchange this time around. They did however pocket a nice profit on Kraken in about 1 minute by selling high (~$66,500) and buying low (~$54,000).
Click here for a larger image (pop-up window)

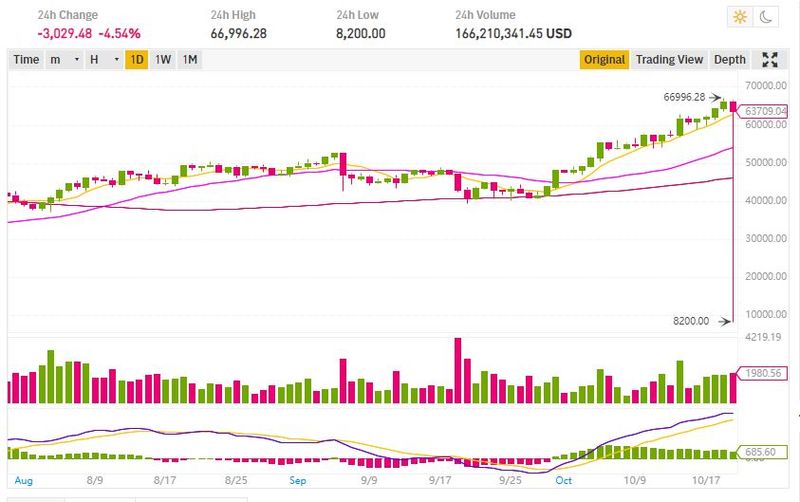
Update 22 Oct 2021: Here is another example on Binance, where BTC dropped 87% from $65,000 to $8,200 in a minute. Apparently, an institutional trader mistakenly sold several hundred BTCs in a matter of seconds, thereby putting enormous downward pressure on price relative to the Binance order book. Clearly, other traders got forcefully exited from their long positions when their stop-loss orders triggered and they possibly lost money. You can read the full story on Bloomberg.
Click here for a larger image (pop-up window)

